
Portfolio.← Case studies

Enterprise performance platform

EPM Next

A financial performance workspace that connects data, context, and conversation—so IBM teams can move from root cause to a shared decision.

Explore
data

Collaborate
in context

Present a
shared story

Project snapshot

Lead product designer · 2023–2024
Research framing, product architecture, interaction design, and prototype direction for an evolving enterprise performance workspace.

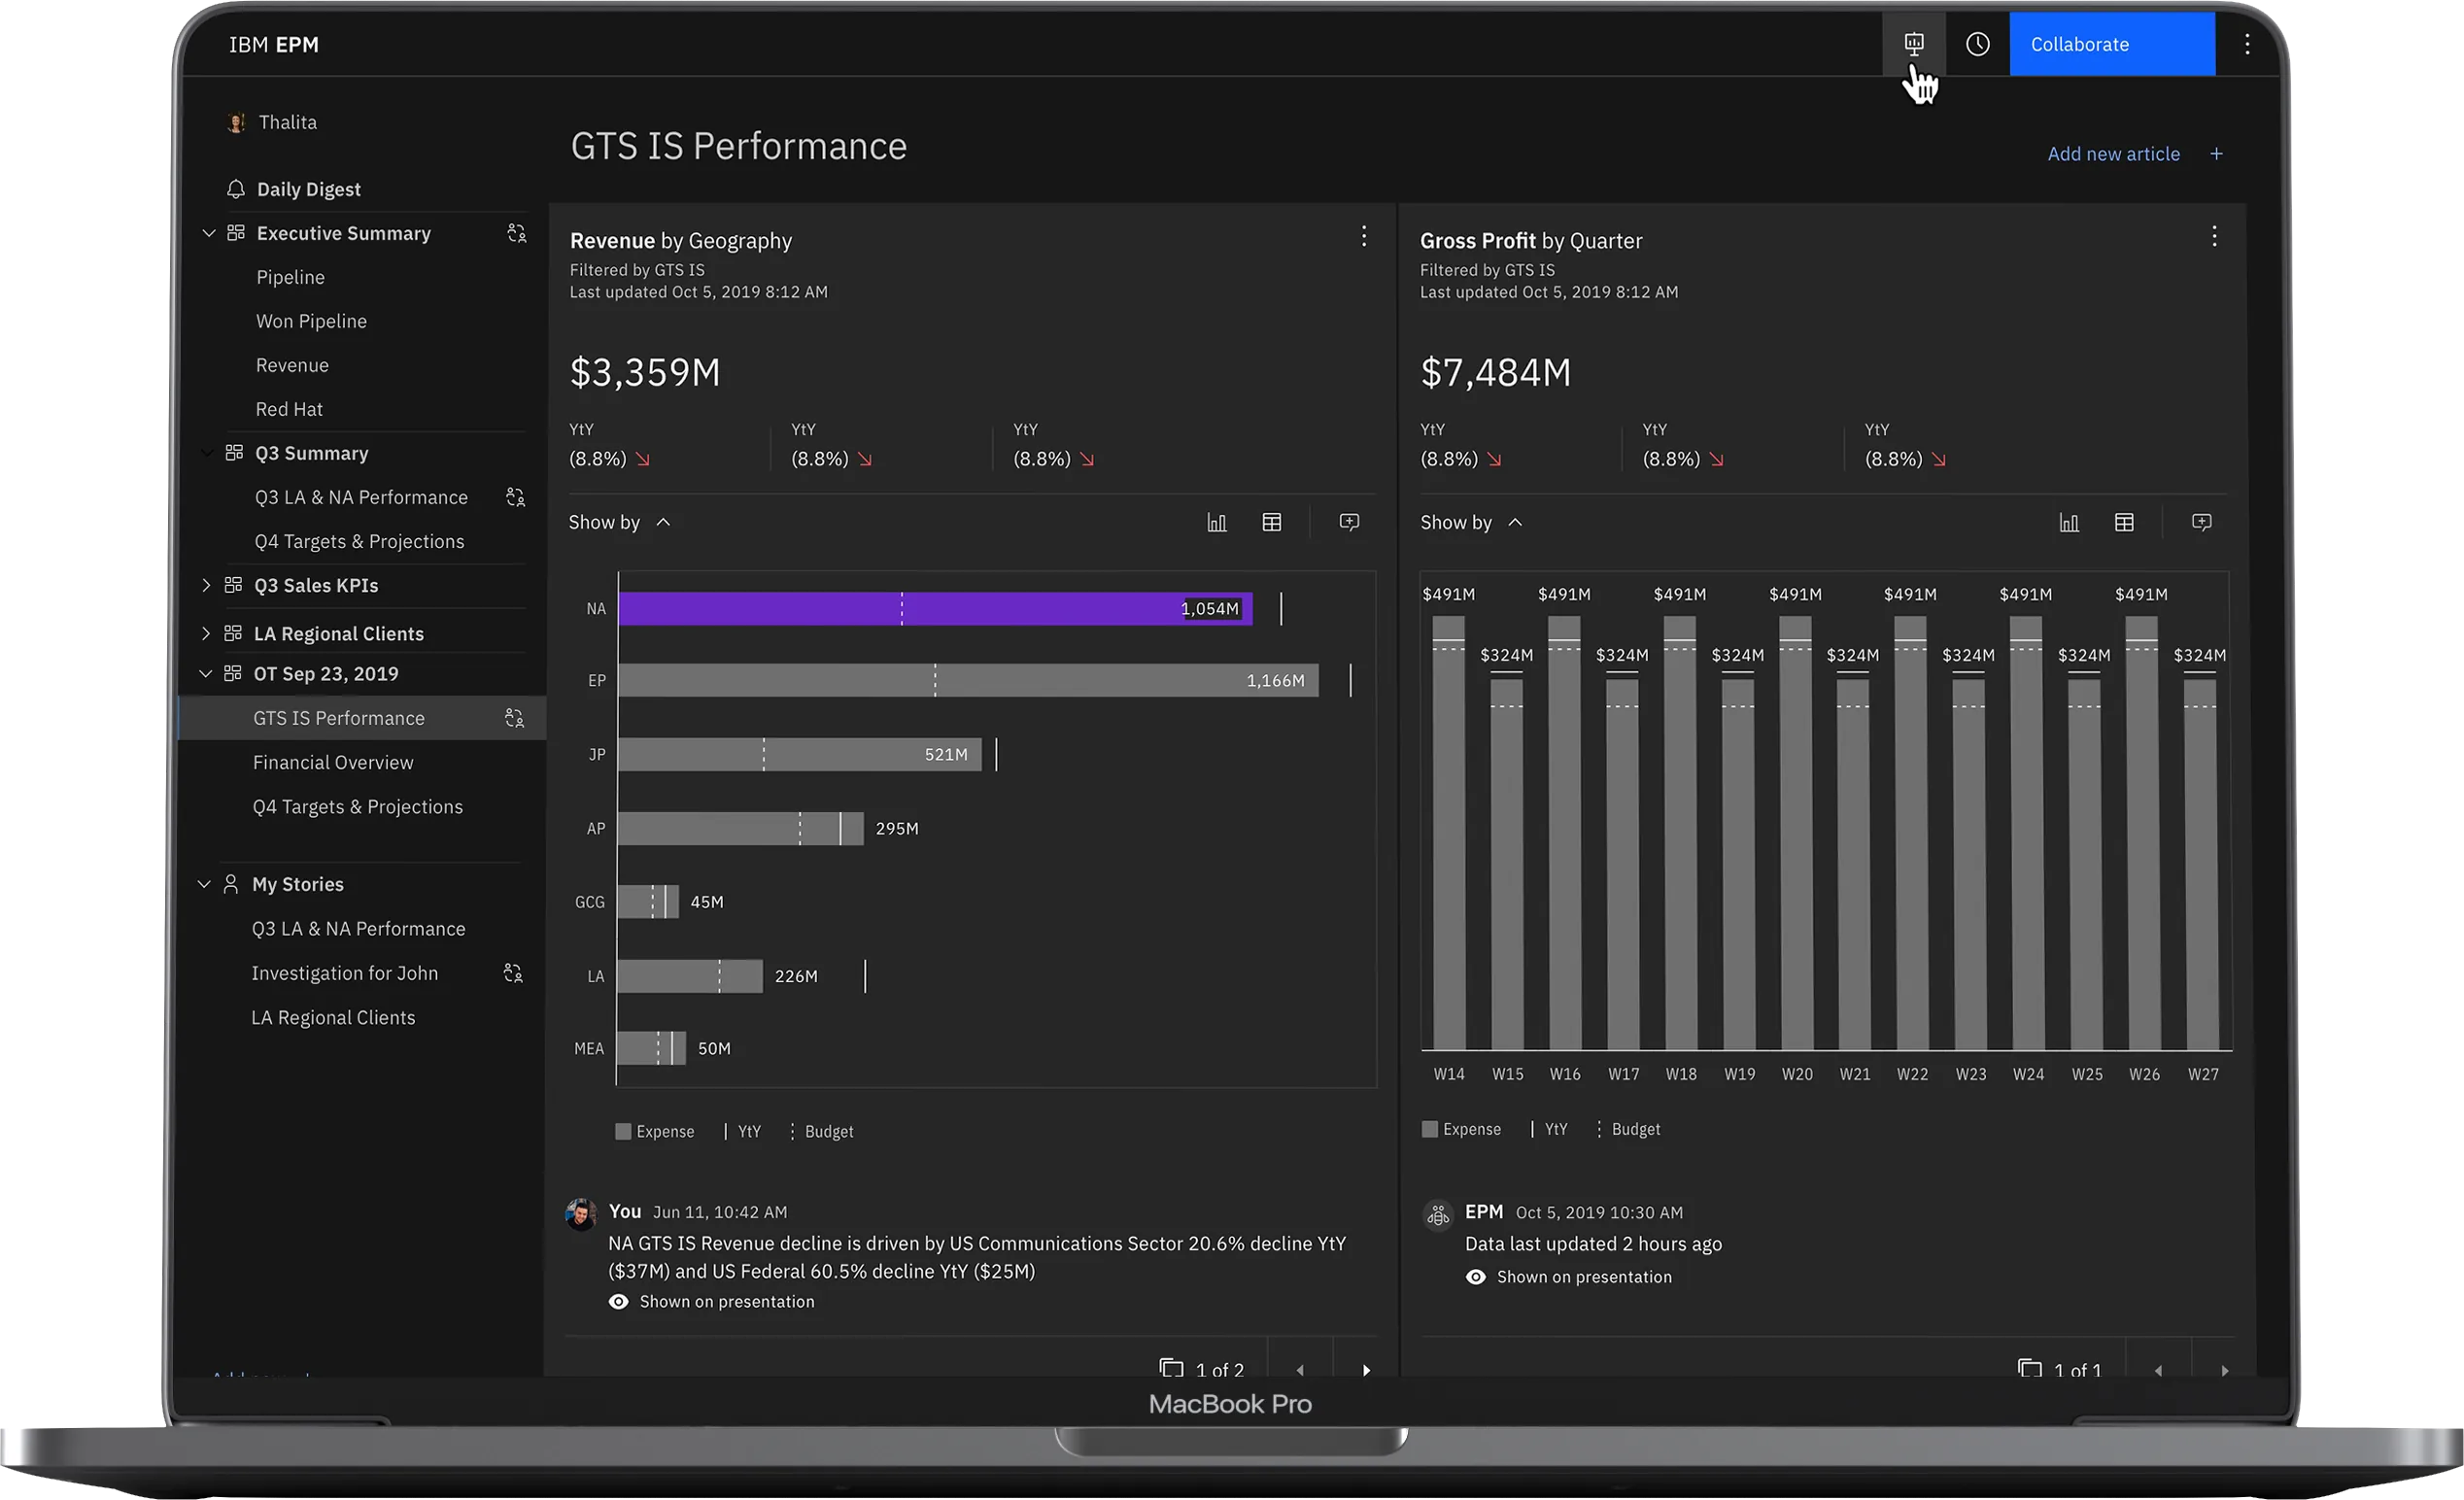
EPM Next desktop performance workspace shown on a MacBook Pro
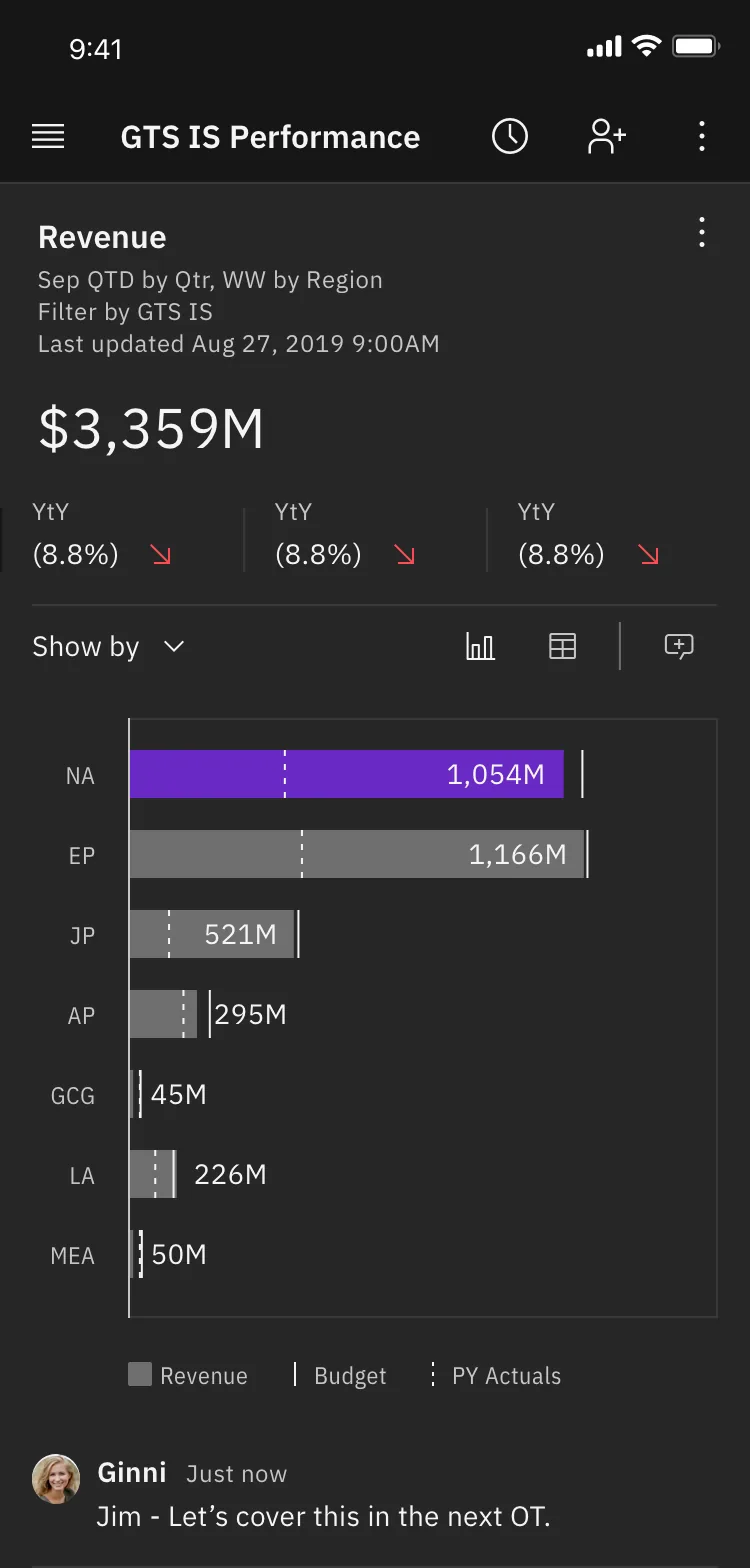
EPM Next Story View shown on an iPhone

Research framing

Performance data is shared work—not a dashboard for one person.

The research focused on how financial signals move between people: from detailed analysis, to an informed point of view, to a decision leaders can act on. The system had to support each step without losing the evidence behind it.

Stakeholder interview session
Fieldwork artifact

Stakeholder conversations across finance and market teams

Research activities

We traced the journey from a signal in the data to the people responsible for moving it forward.

01

Stakeholder interviews

Conversations across finance, market, and business teams revealed how a performance question changes with responsibility.

02

Workflow inventory

We mapped daily digests, executive summaries, regional reviews, and personal stories to see where context was lost between surfaces.

03

Role & permission mapping

Clarifying the responsibilities of leaders, advisors, and analysts made differentiated access—and shared artifacts—a core system requirement.

What we synthesised

Signal → context → decision

One signal becomes a decision through three connected roles.

Leaders role profile01

Orient & decide

Leaders

Need an immediate read on performance signals, the context behind them, and where a decision is needed.

I need to see what changed, why it matters, and whether we need to act—without opening five different reports.Representative research voice · Leadership review
Advisors role profile02

Frame & align

Advisors

Turn analysis into a clear point of view, then bring the right narrative to the people who need it.

The number alone never tells the whole story. I need enough context to explain the shift before the conversation moves on.Representative research voice · Business advisory
Analysts role profile03

Investigate & explain

Analysts

Explore data in depth, validate assumptions, and bring evidence into the broader conversation.

When someone asks where a number came from, I need to retrace the calculation quickly and share the evidence with them.Representative research voice · Performance analysis

As-is scenario & survey

Before a team can act on the data, they have to find their way through the work.

Everyday reporting moments

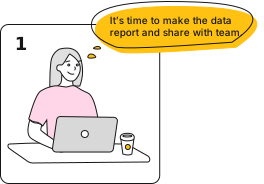
As-is scenario: preparing a report to share with the team
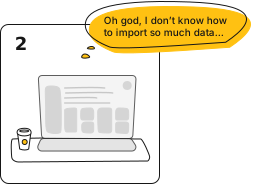
As-is scenario: struggling to import data
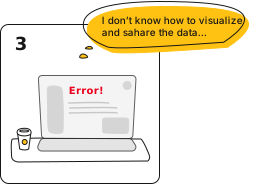
As-is scenario: struggling to visualise and share data
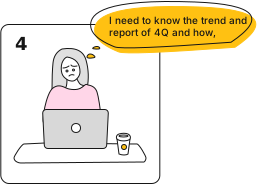
As-is scenario: trying to understand quarterly trends

Survey signals

Survey snapshot

How many people knew how to make a report?

62%
  • 16%People knew exactly how to make the report.
  • 22%People didn’t know, but learned along the way.
  • 62%People didn’t know how to make and visualise the report.

Where did people have issues?

Create story62%
Create article78%
Collaborate55%
Annotation22%

Project research snapshot · stakeholder interviews, group sessions, and survey responses informed the priority exercise shown here.

From evidence to focus

Not every pain point needs the same response—or the same urgency.

We paired user impact with delivery feasibility to identify the work that would make the biggest difference first.

Decision criteria

Balance delivery feasibility with user impact before defining the product focus.

Assess feasibility

Can we make this easier to resolve?

Product, design, and engineering considered technical effort, time, and cost across the reporting workflow.

Very difficultDifficultNormalEasyVery easy
Article template8/10
Meaning of graphic6/10
Walk me through4/10
Highlight2/10
Information organised4/10
Article management6/10
Story view10/10
Case card6/10
Annotation5/10
Collaboration9/10

Prioritise impact

Which opportunities are ready to move?

High-impact, feasible improvements formed the first product focus.

Delivery feasibilityUser impactEasyDifficultLowerHigher7.552.55
Prioritise first
Story viewAnnotationCollaborationArticle templateArticle manageMeaning of graphicInformation organisedCase cardWalk meInformation organized

Focus areas

Three connected areas became the foundation for the solution.They form one continuous path: enter the work with clarity, build a shared understanding, then carry that understanding into a decision.

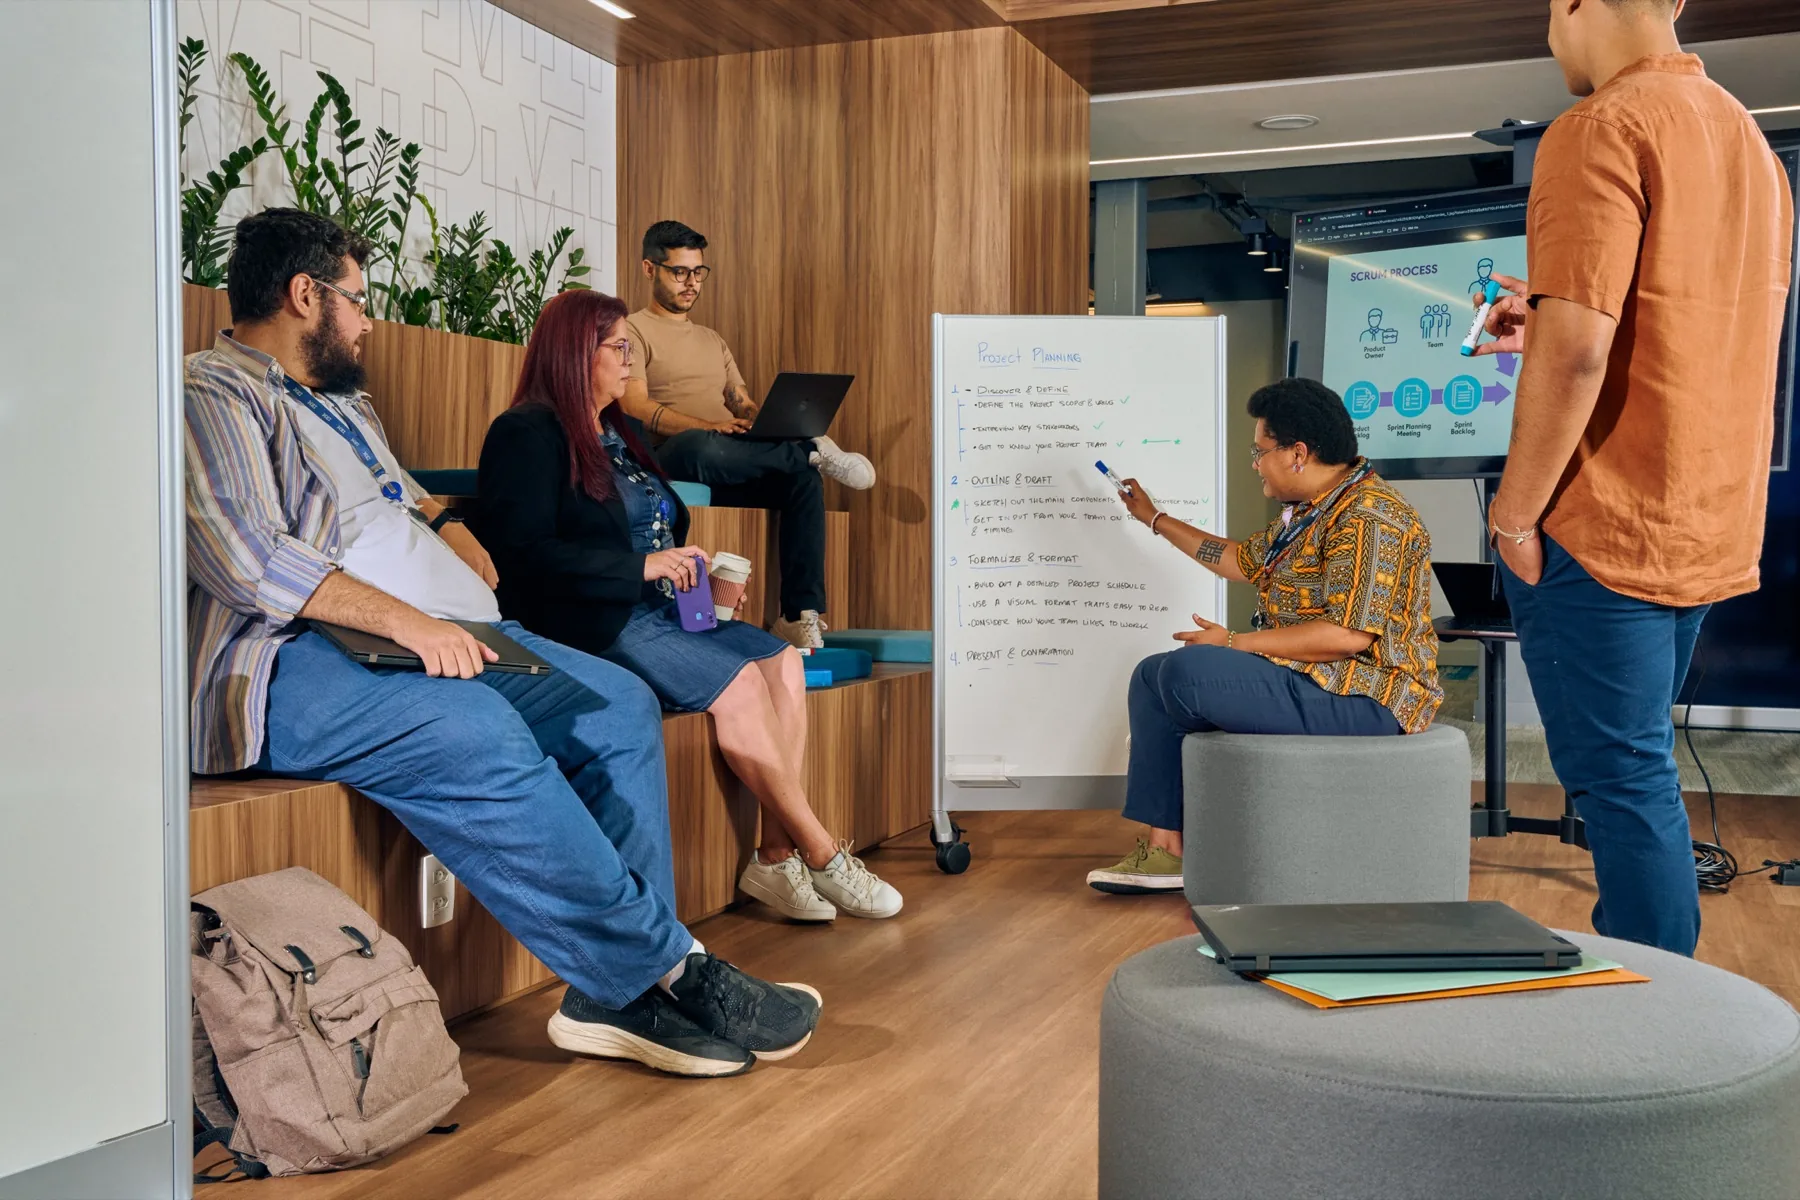
Team collaborating in a project planning workshop
Co-design workshop

Turning the prioritised opportunities into a shared product direction.

  1. 01

    Access & setup

    Start each role with the right entry point: relevant signals, clear permissions, and enough context to understand where to begin.

    Reduce the effort of getting oriented before analysis begins.
  2. 02

    Case, story & article

    Connect the working layers of analysis so measures, explanations, feedback, and decisions stay together as a story takes shape.

    Make context portable instead of rebuilding it across tools.
  3. 03

    Presentation

    Bring the evidence and point of view into the moments where teams review, discuss, and decide—without losing the thread behind a number.

    Turn preparation into a shared, decision-ready narrative.

From research to a product direction

Research showed the work breaks down when evidence, analysis, and discussion live in separate places.

Performance reporting is a shared decision workflow—not just a dashboard.

EPM Next connects a common performance model with the work of understanding, discussing, and acting on a signal—not another surface for reading reports.

Evidence archive

Workshop evidence revealed the gap.

Teams could make reports, but struggled to carry evidence into a shared decision.

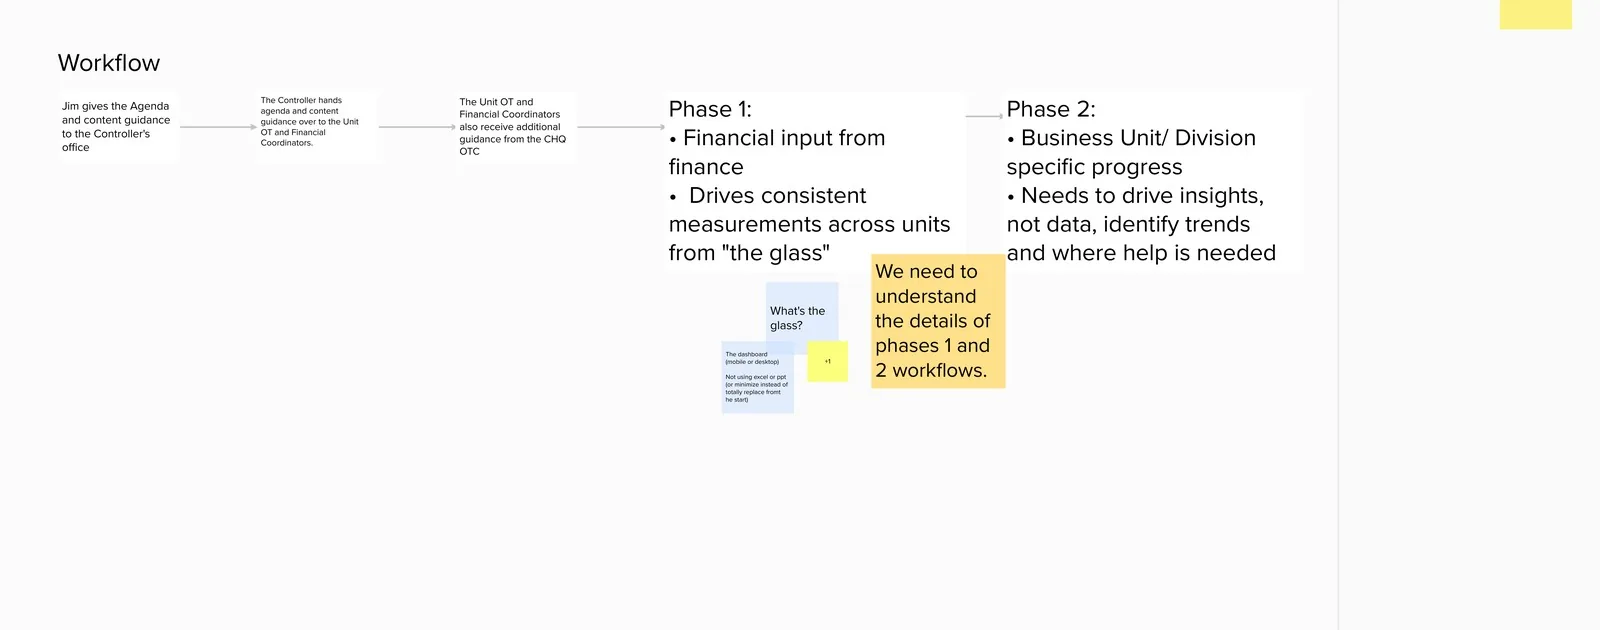
Operational-technology workshop mapping financial input and business-unit insight needs
01 · OT kickoff

Consistent measures and usable progress signals.

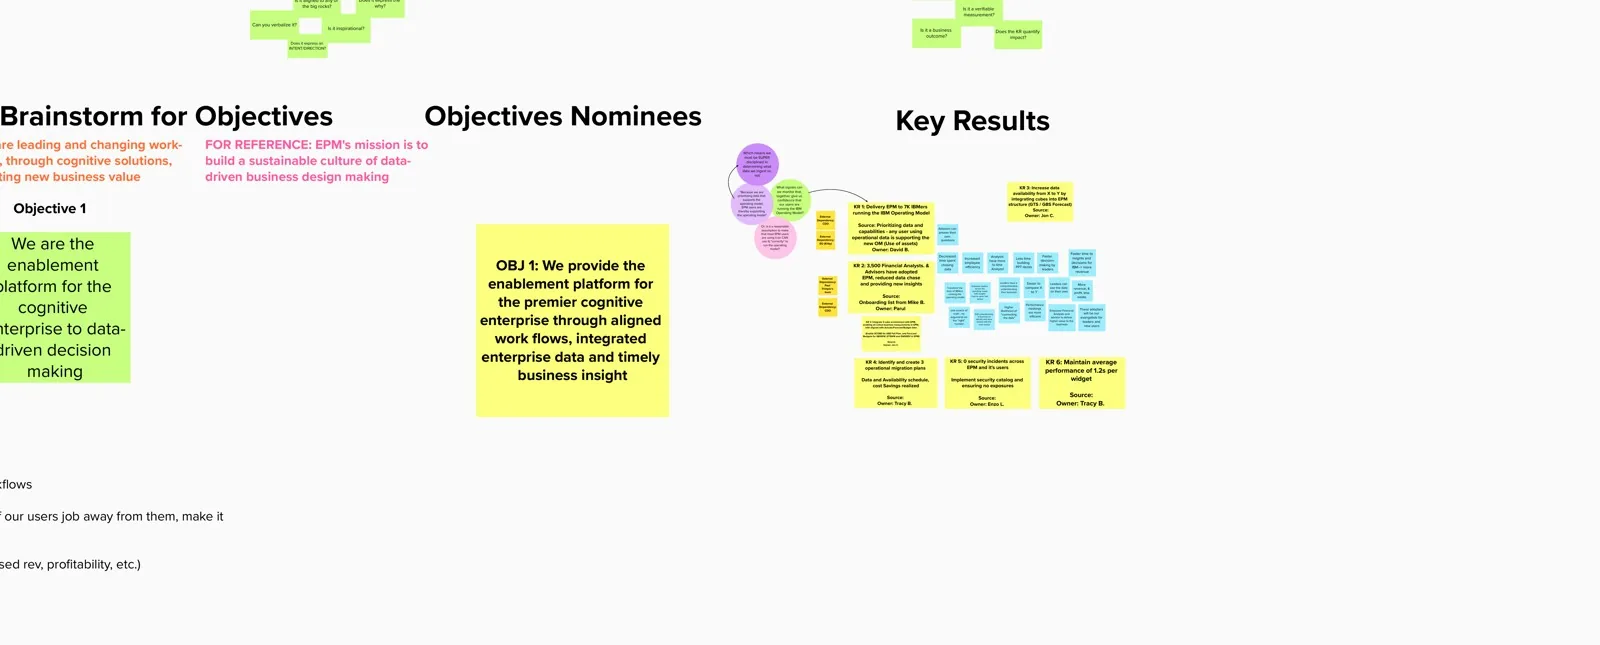
EPM-wide workshop board connecting the product mission, aligned workflows, integrated data, and business insight
02 · EPM-wide planning

Shared workflows and integrated data enabled timely insight.

Synthesised product premise

Turn the evidence into a system that supports the whole reporting job.

The product direction was a deliberate response to the work we observed—not a feature list.

  1. 01

    Financial inputs and reporting handoffs were hard to align across units.

    A common performance foundation

    Shared measures, role-aware access, and the context behind the number.

    One trusted view for every discussion.

  2. 02

    Teams could see the number, but the reason behind it lived in separate files, conversations, and decks.

    An evidence-linked reporting workflow

    Connect source data, analysis, and narrative in the same working space.

    Insight stays with the signal.

  3. 03

    Analysis was too easily rebuilt for every review, often by one person at a time.

    A shared decision space

    Keep observations, feedback, and follow-up with the performance story.

    Faster, better-aligned decisions.

Information architecture

A system for carrying context forward.

Three system decisions

  1. 01

    Use one shared performance model

    Different roles needed different views, but every view had to draw on the same measures, dimensions, and permissions.

  2. 02

    Carry context through connected objects

    A question should stay traceable as it moves from data, to analysis, to a story, then into a shared case.

  3. 03

    Make the structure legible in the moment

    Research showed that unfamiliar labels and hidden actions break the flow, so language and interaction needed to do explanatory work.

Research validation

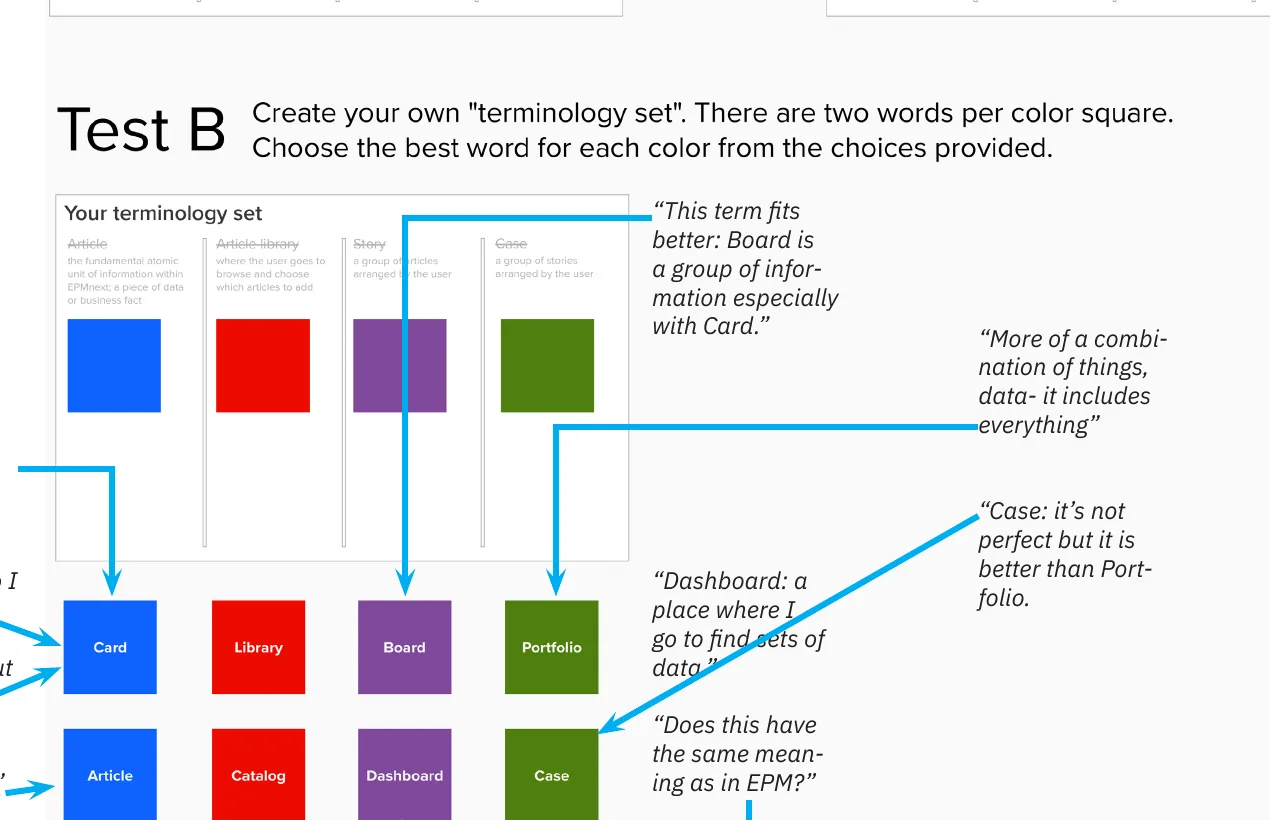
17 beta participants · Study 7 terminology card sort

“They are both nebulous to me, hard to make a distinction between the two.”

The study surfaced terminology as the harder problem: people needed clearer in-product explanation to distinguish Article, Story, and Case.

— Beta participant, analyst/advisor
Study 7 terminology card-sort exercise with participant feedback
Study 7 · terminology card sort

Core object model

A Case brings together multiple Stories; each Story organises evidence as Articles.
Shared foundation · 01

Performance model

Measures · dimensions · permissions

One governed source for every reporting object.
Shared decision context · 01

Case

Holds the question, ownership, related stories, and follow-up.

contains 1..n Stories
Story · 1..n

Variance narrative

What changed—and why.

Articles · 1..n
Article

Actuals by market

Article

Variance drivers

Audience
Business lead
Decision
Root cause
Story · 1..n

Scenario outlook

Compare possible paths.

Articles · 1..n
Article

Baseline forecast

Article

Sensitivity view

Audience
Finance team
Decision
Plan response
Story · 1..n

Operating risk

Surface what needs action.

Articles · 1..n
Article

Exposure by region

Article

Mitigation status

Audience
Operations
Decision
Assign owner
Story · 1..n

Decision brief

Align on next actions.

Articles · 1..n
Article

Recommendation

Article

Decision record

Audience
Leadership
Decision
Agree next step
Story · 1..n

Market comparison

Compare signals across units.

Articles · 1..n
Article

Regional benchmark

Article

Trend comparison

Audience
Market lead
Decision
Set priority

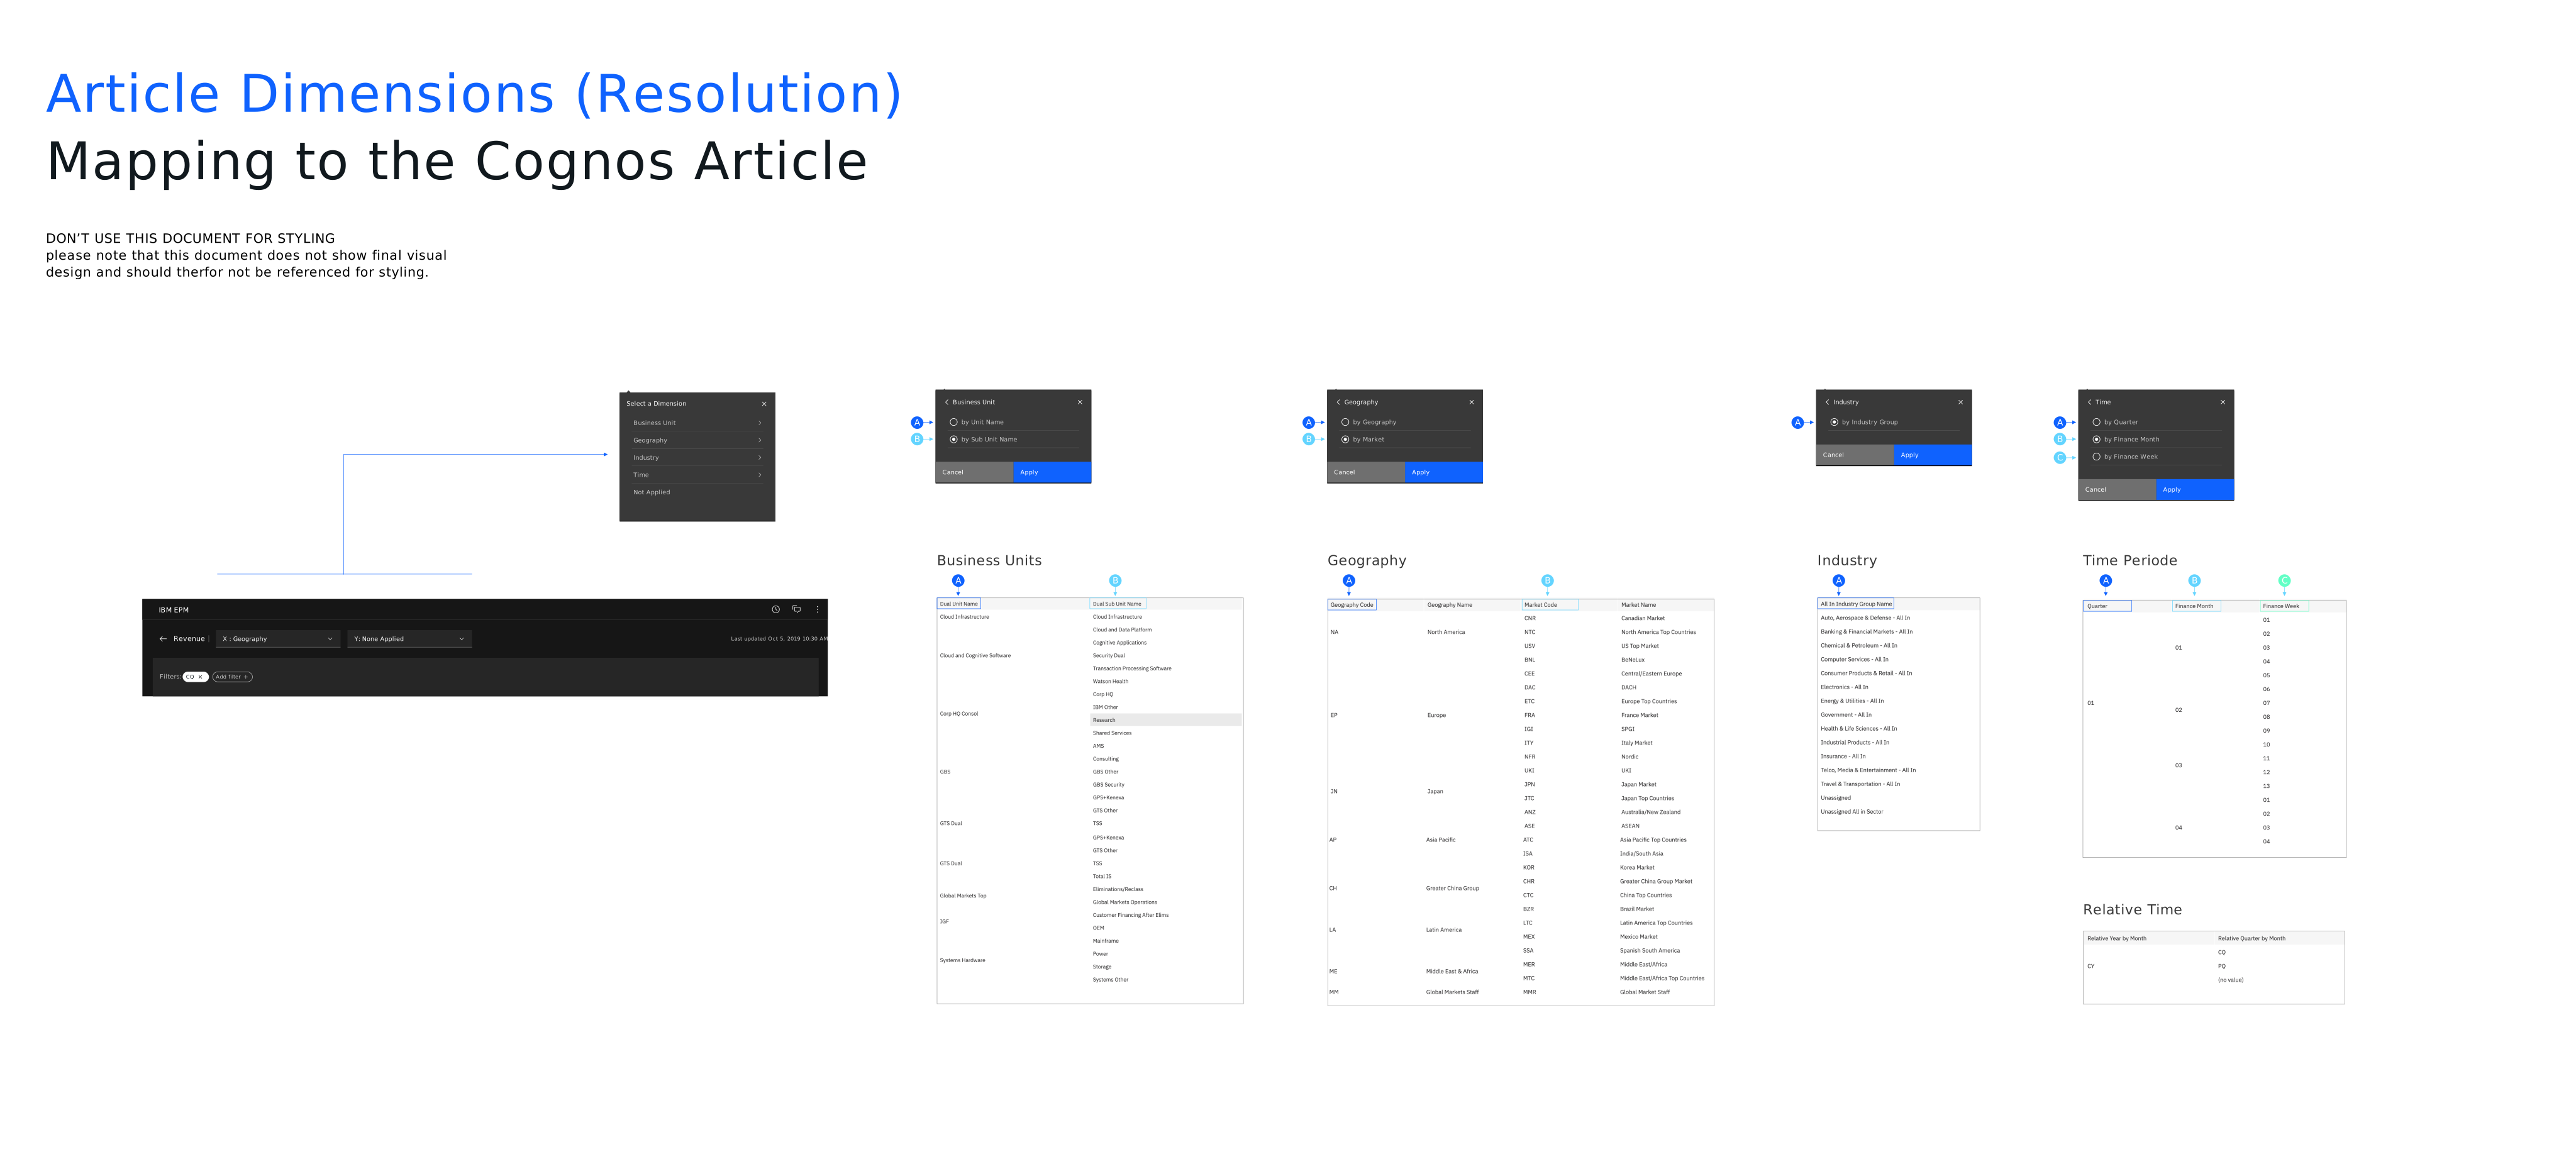
Data model mapping

Make the underlying data model navigable for people—not just systems.

The Cognos model contained the logic behind performance reporting. I translated its technical dimensions into the filters, views, and levels of detail people use to explore a report.

Article dimensions mapped to Cognos article data

Wireframes & interaction

Move from a signal to a shared decision—without losing the trail.

Scenario-based beta research exposed failures at the hand-offs: people missed hidden actions, could not always find deeper evidence, and had trouble understanding new content labels. I iterated the flow around those moments—not just individual screens.

Research-led interaction flow

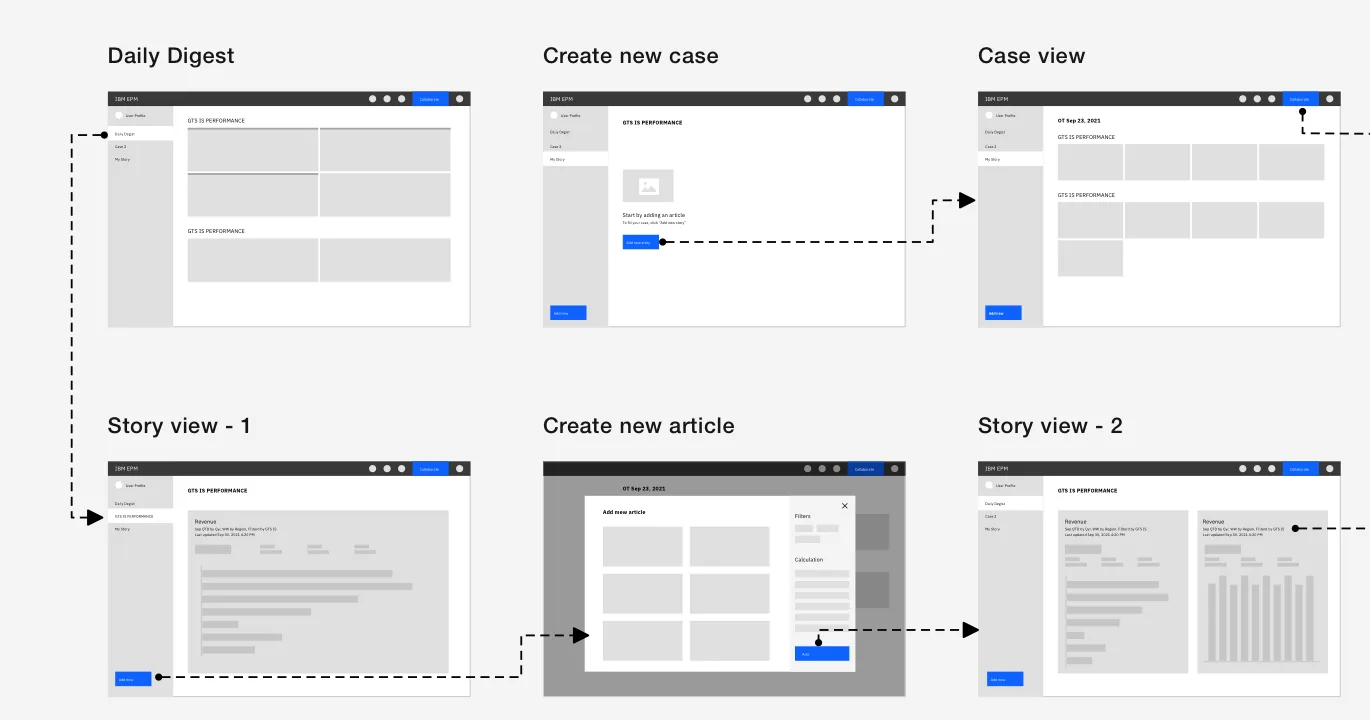
Early flow map

I mapped the hand-offs before styling individual screens.

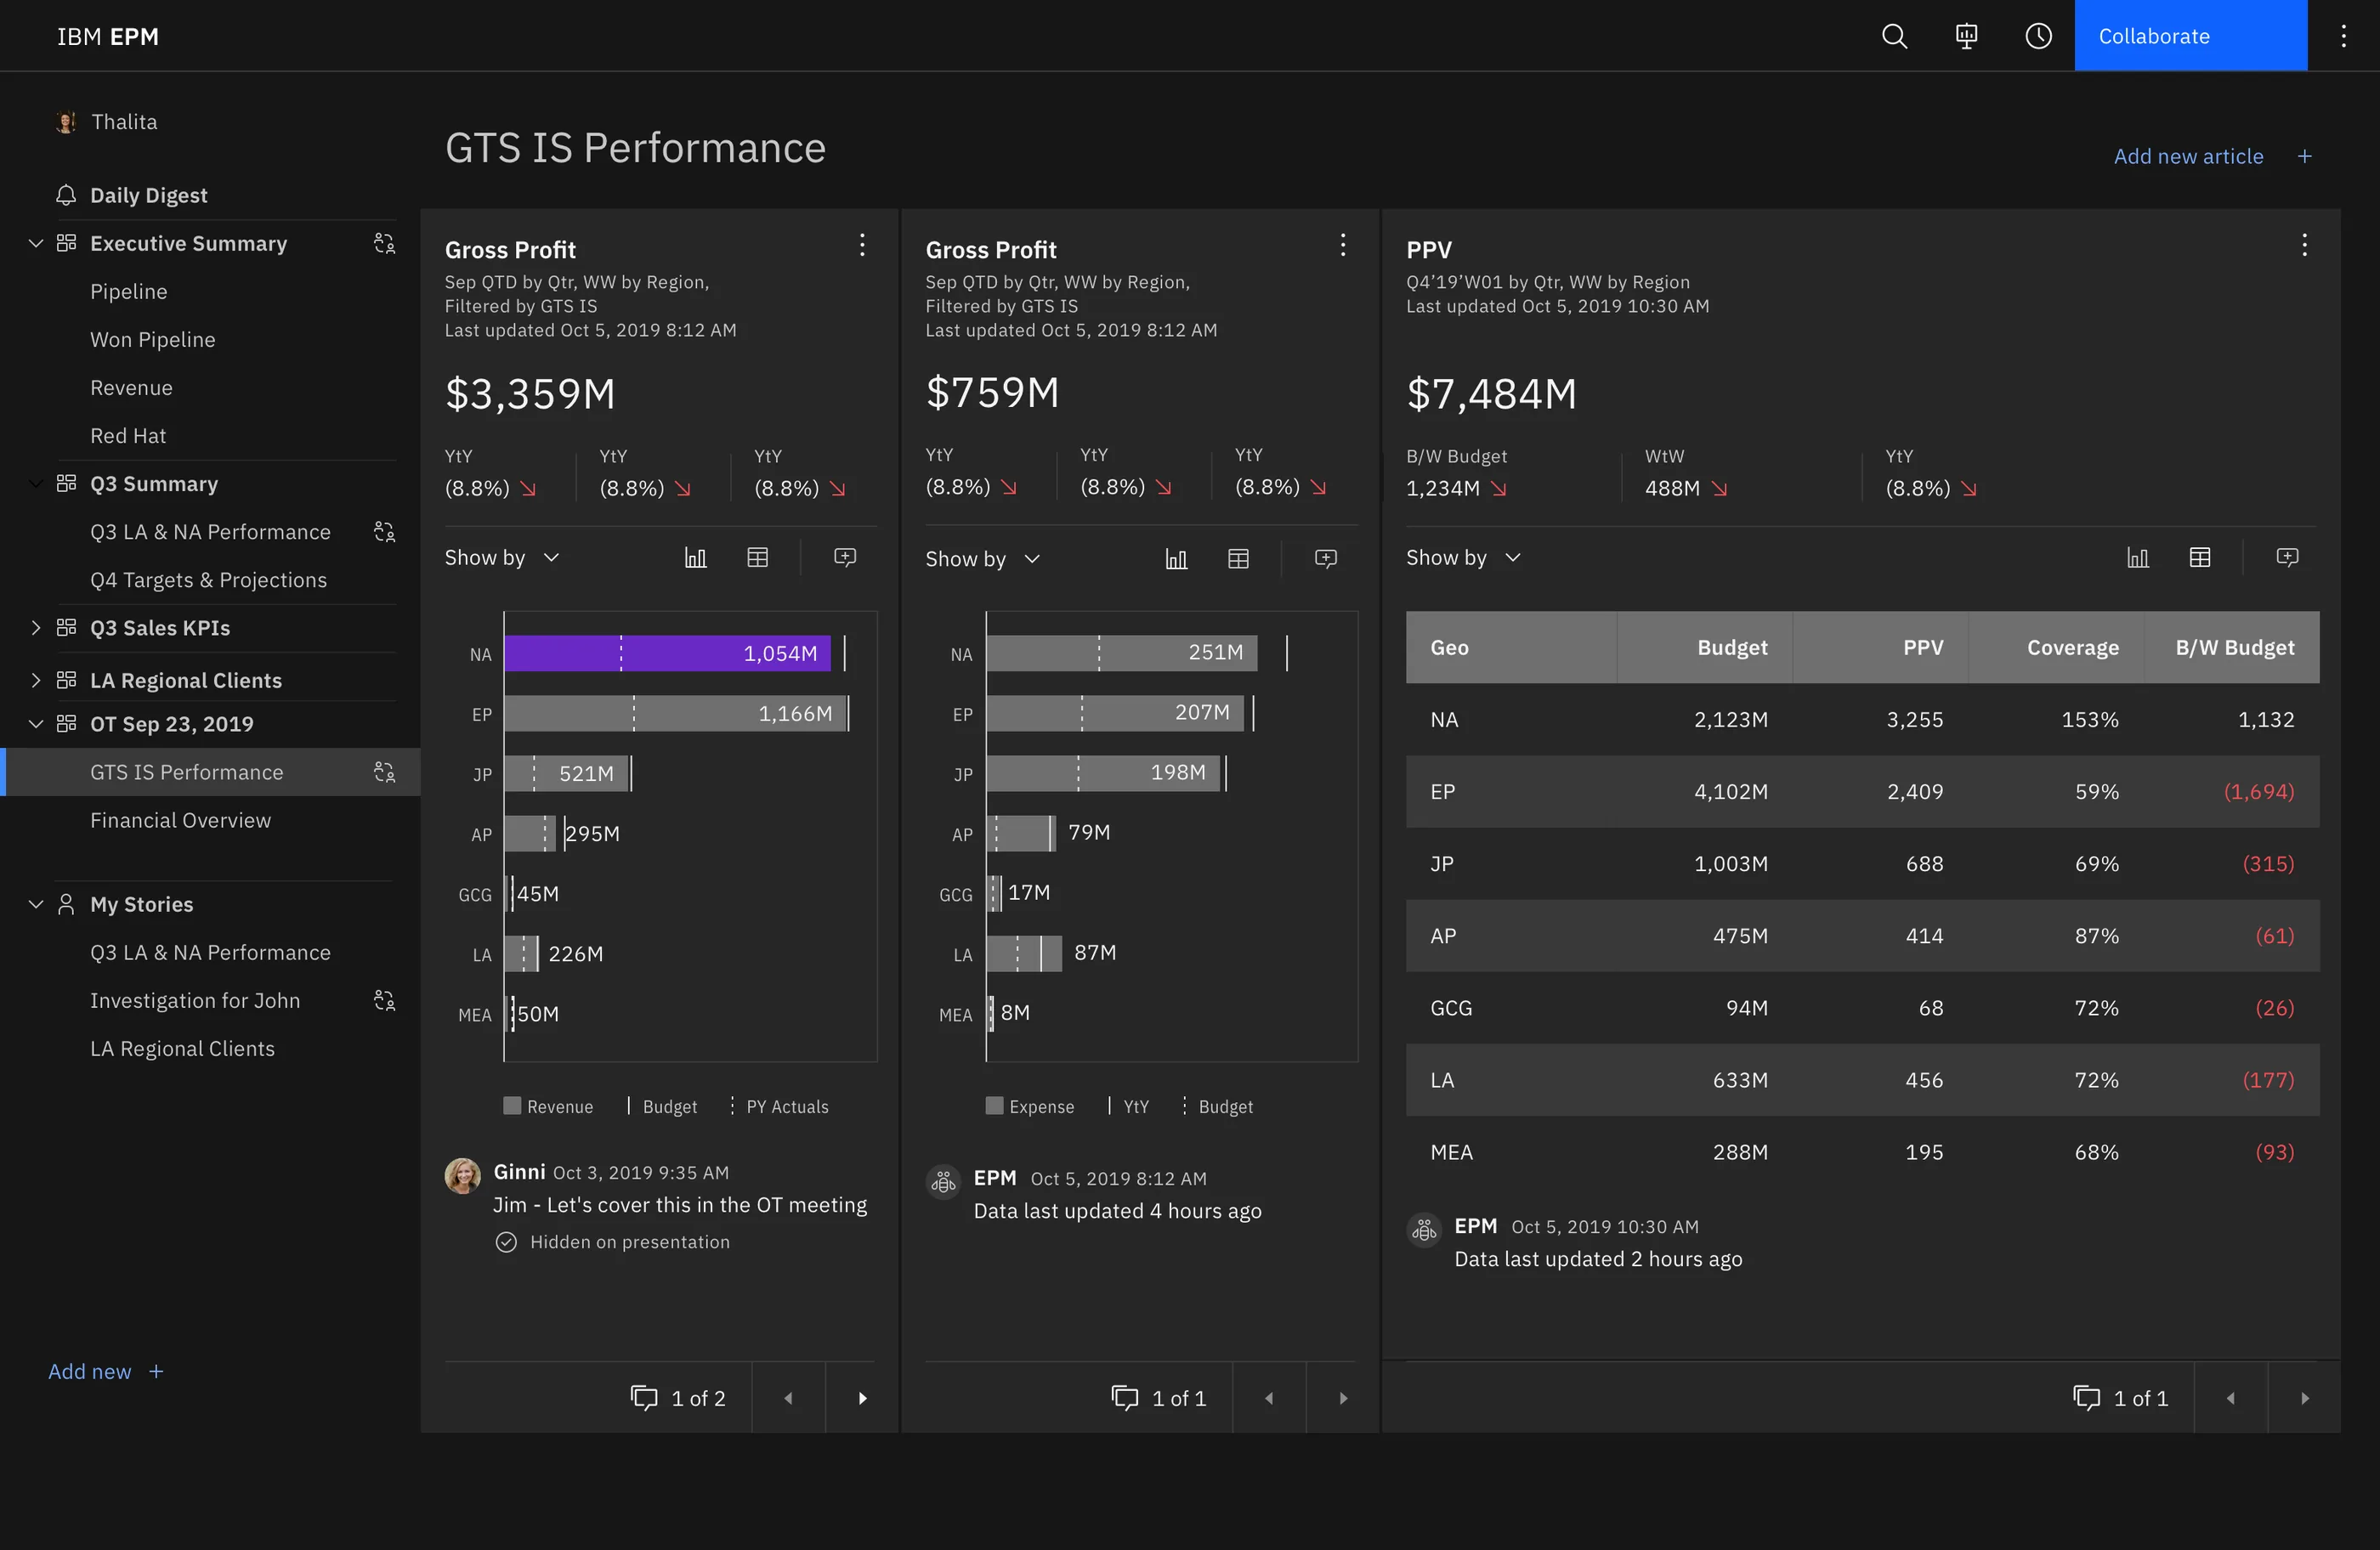
The wireframe made the route from Daily digest, to Case, to Story—and then into new evidence—explicit before the final interface.

Early EPM Next wireframe flow showing Daily Digest, Case, Story, and Create Article hand-offs
  1. 01

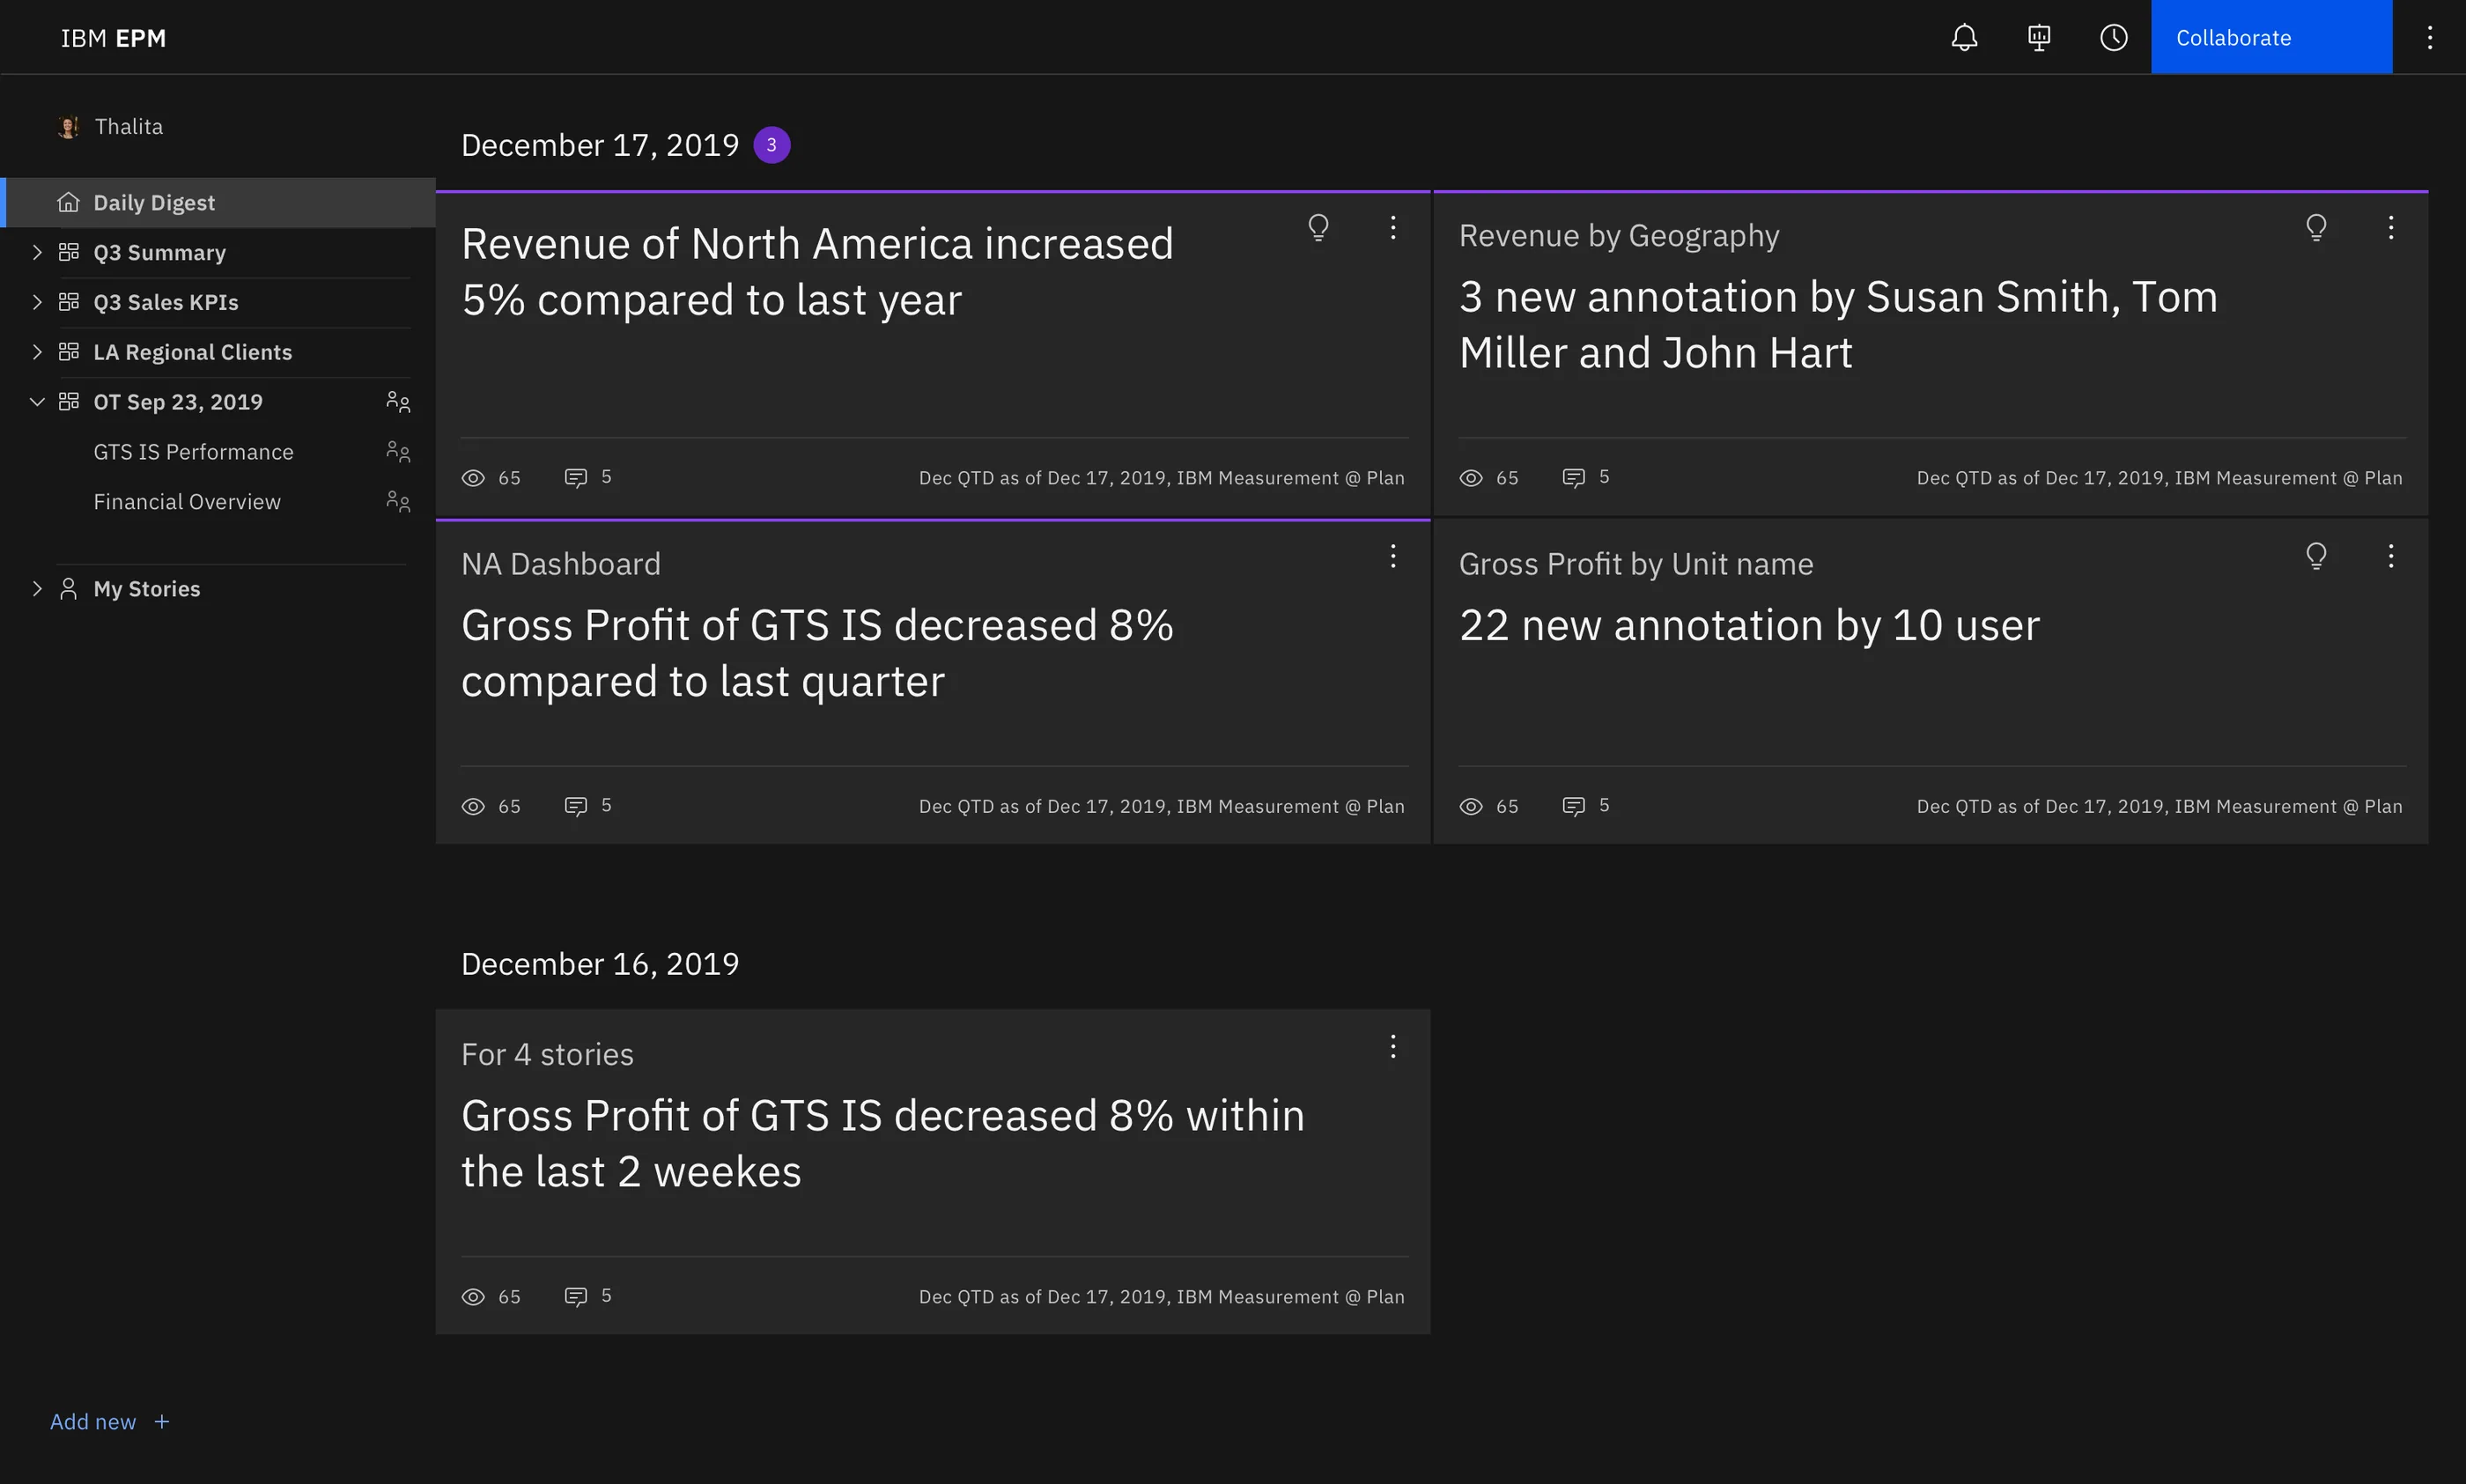
    Daily digest

    Daily digest EPM Next prototype screen

    Spot the signal

    Start with the changes that need attention, rather than a blank reporting surface.

  2. 02

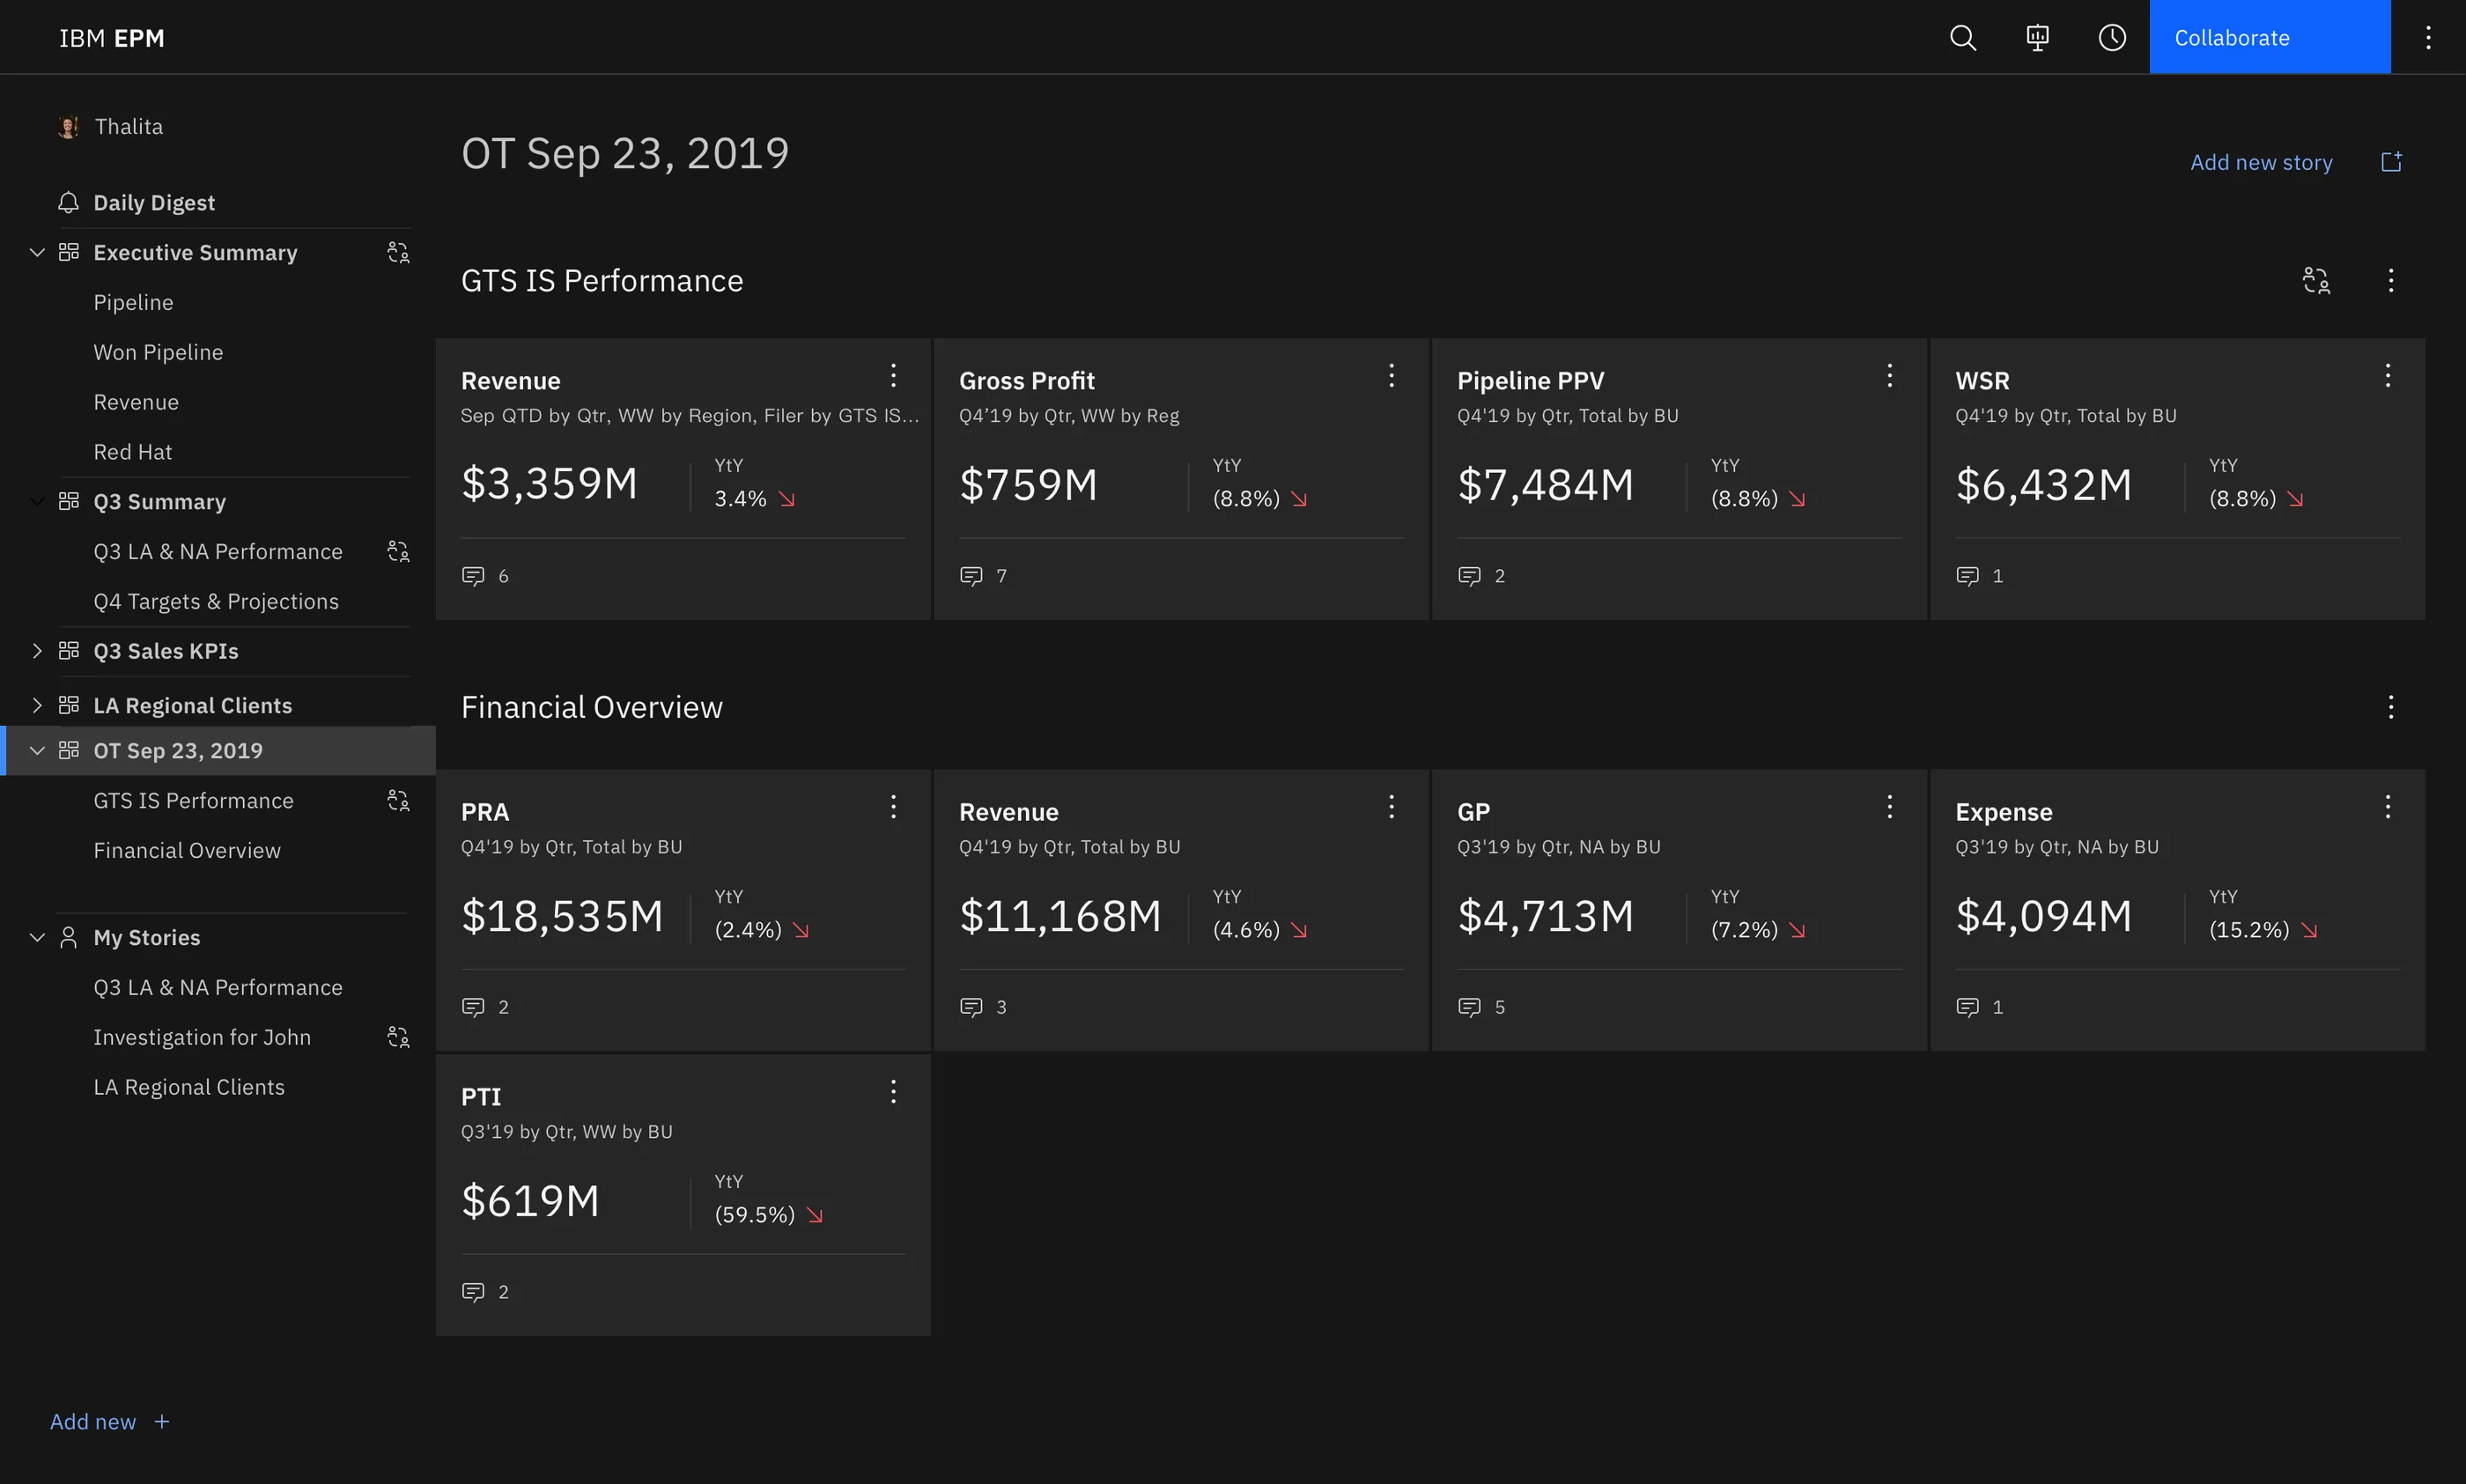
    Case view

    Case view EPM Next prototype screen

    Frame the decision

    Bring related indicators, stories, and collaborators into one shared decision context.

  3. 03

    Story view

    Story view EPM Next prototype screen

    Build a point of view

    Connect analysis and narrative so another person can understand what the data is saying.

  4. 04

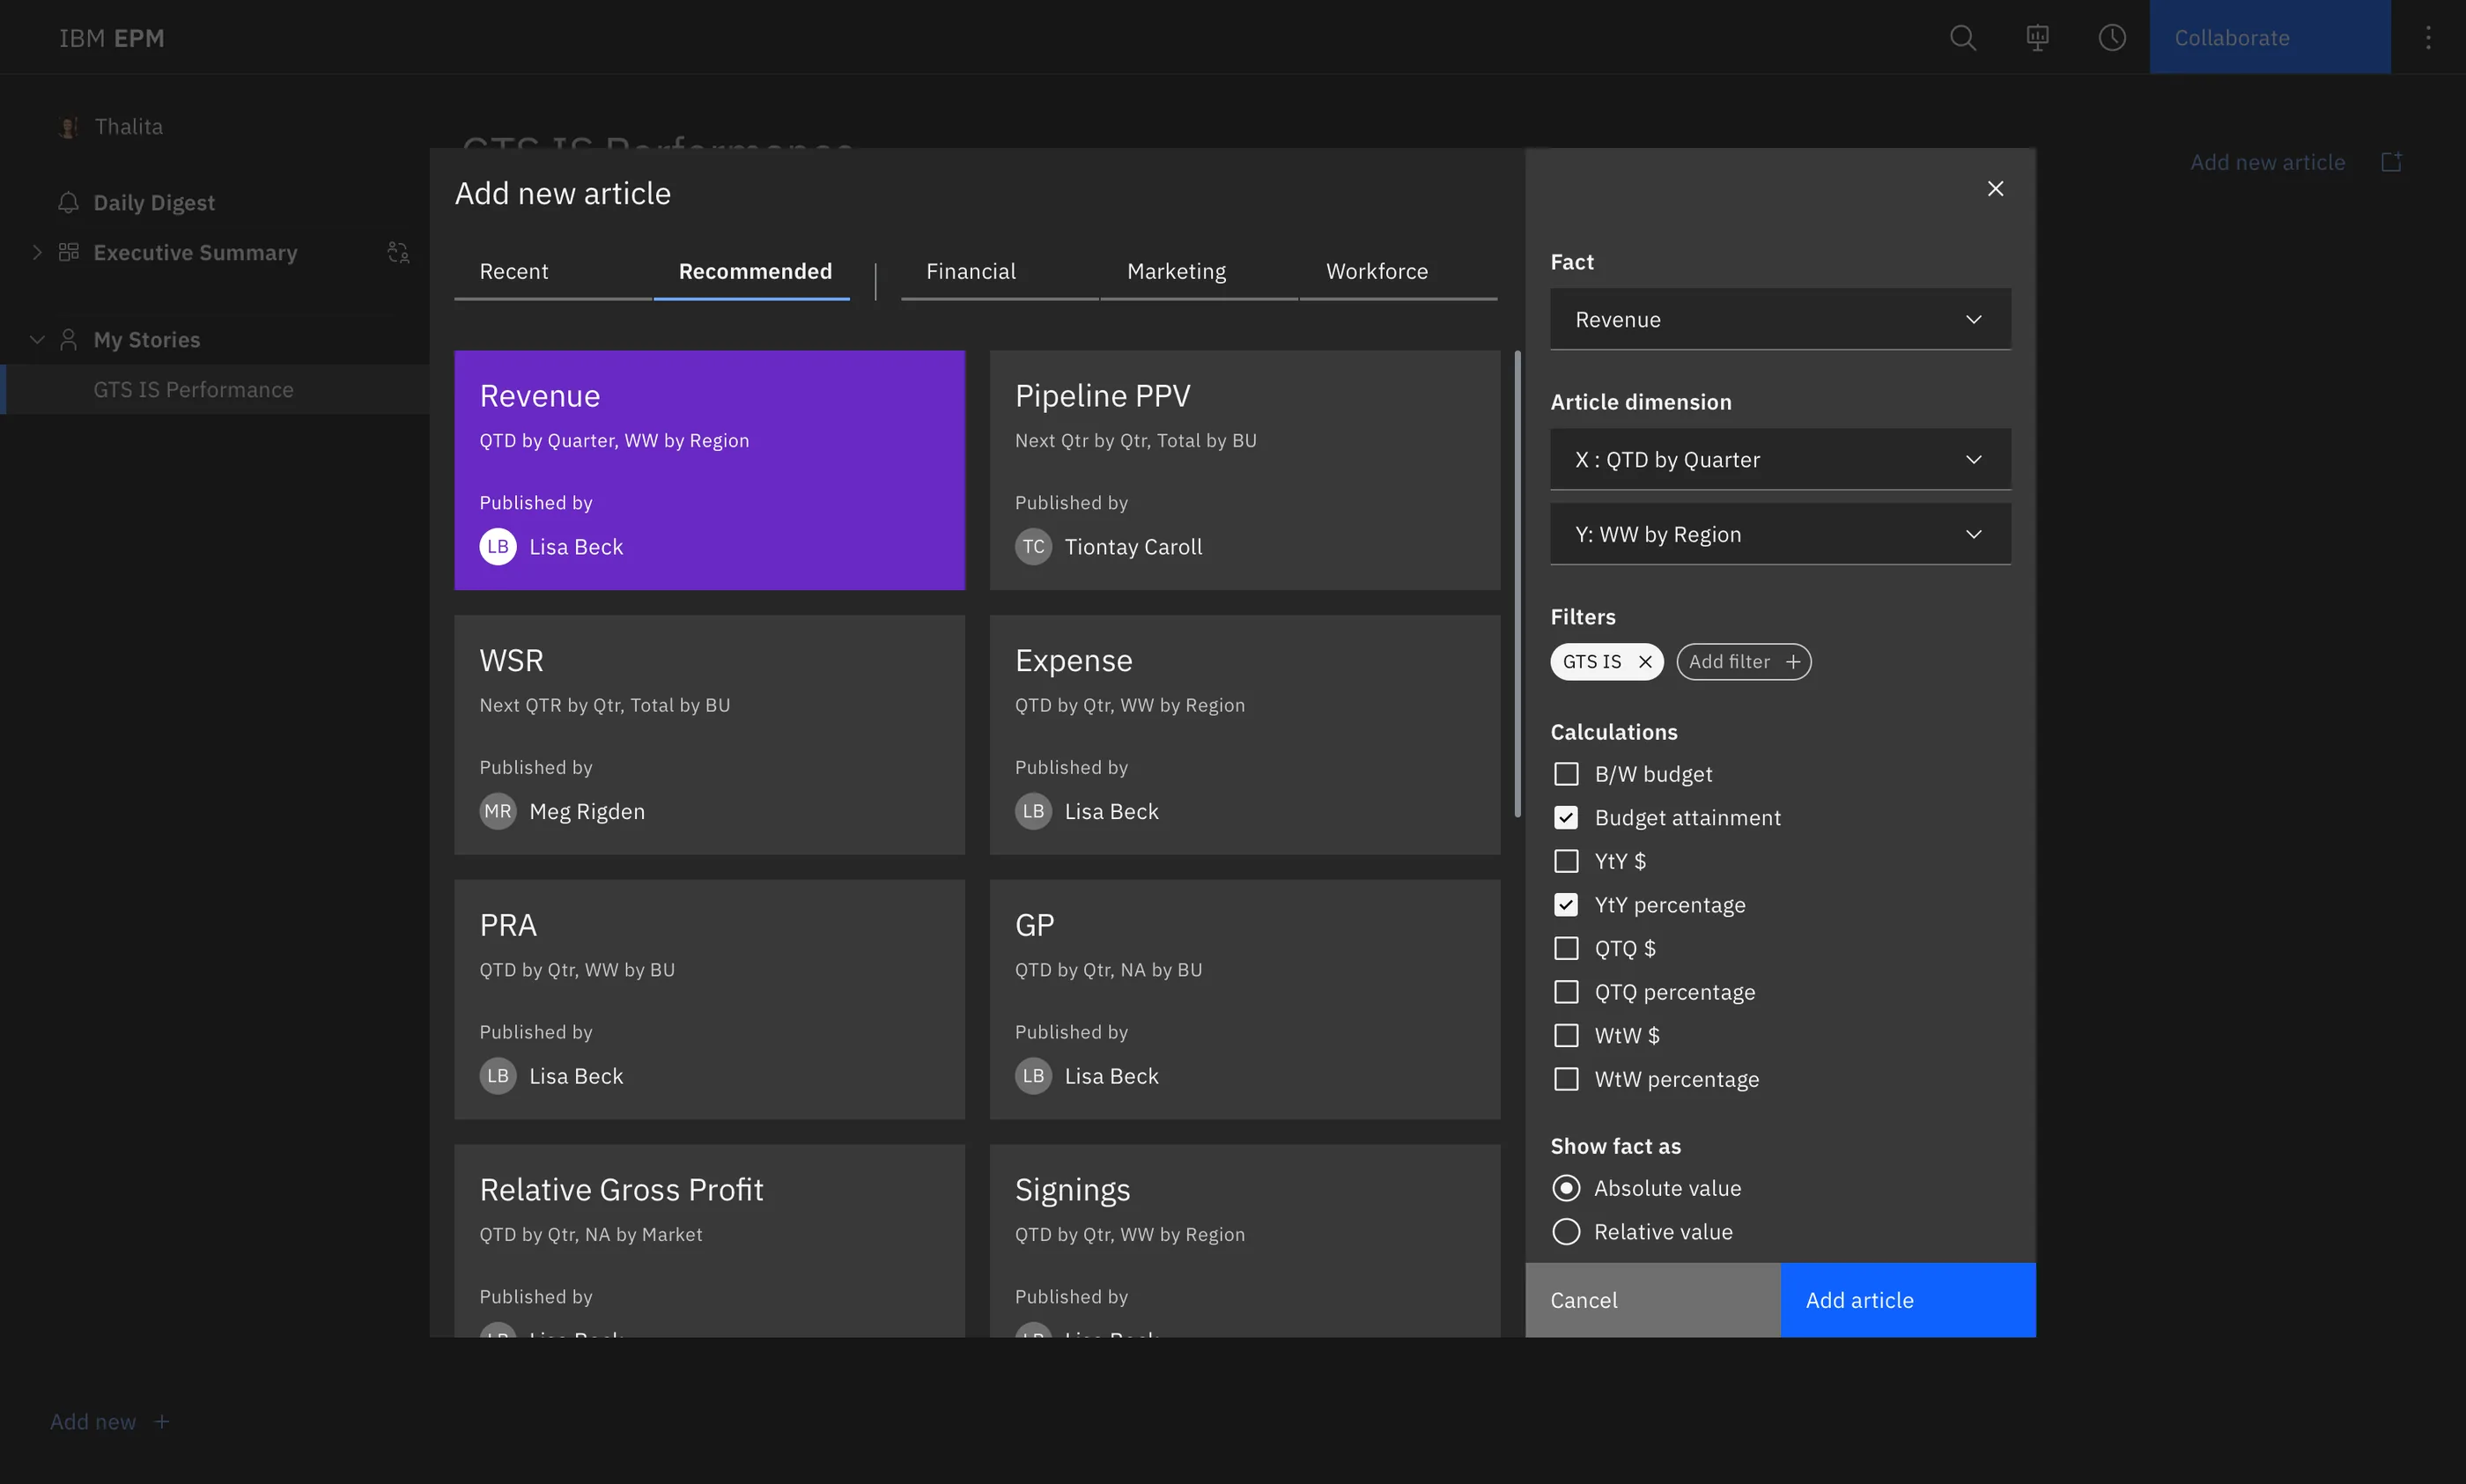
    Create article

    Create article EPM Next prototype screen

    Add evidence in context

    Choose and configure the supporting data without leaving the performance story.

  5. 05

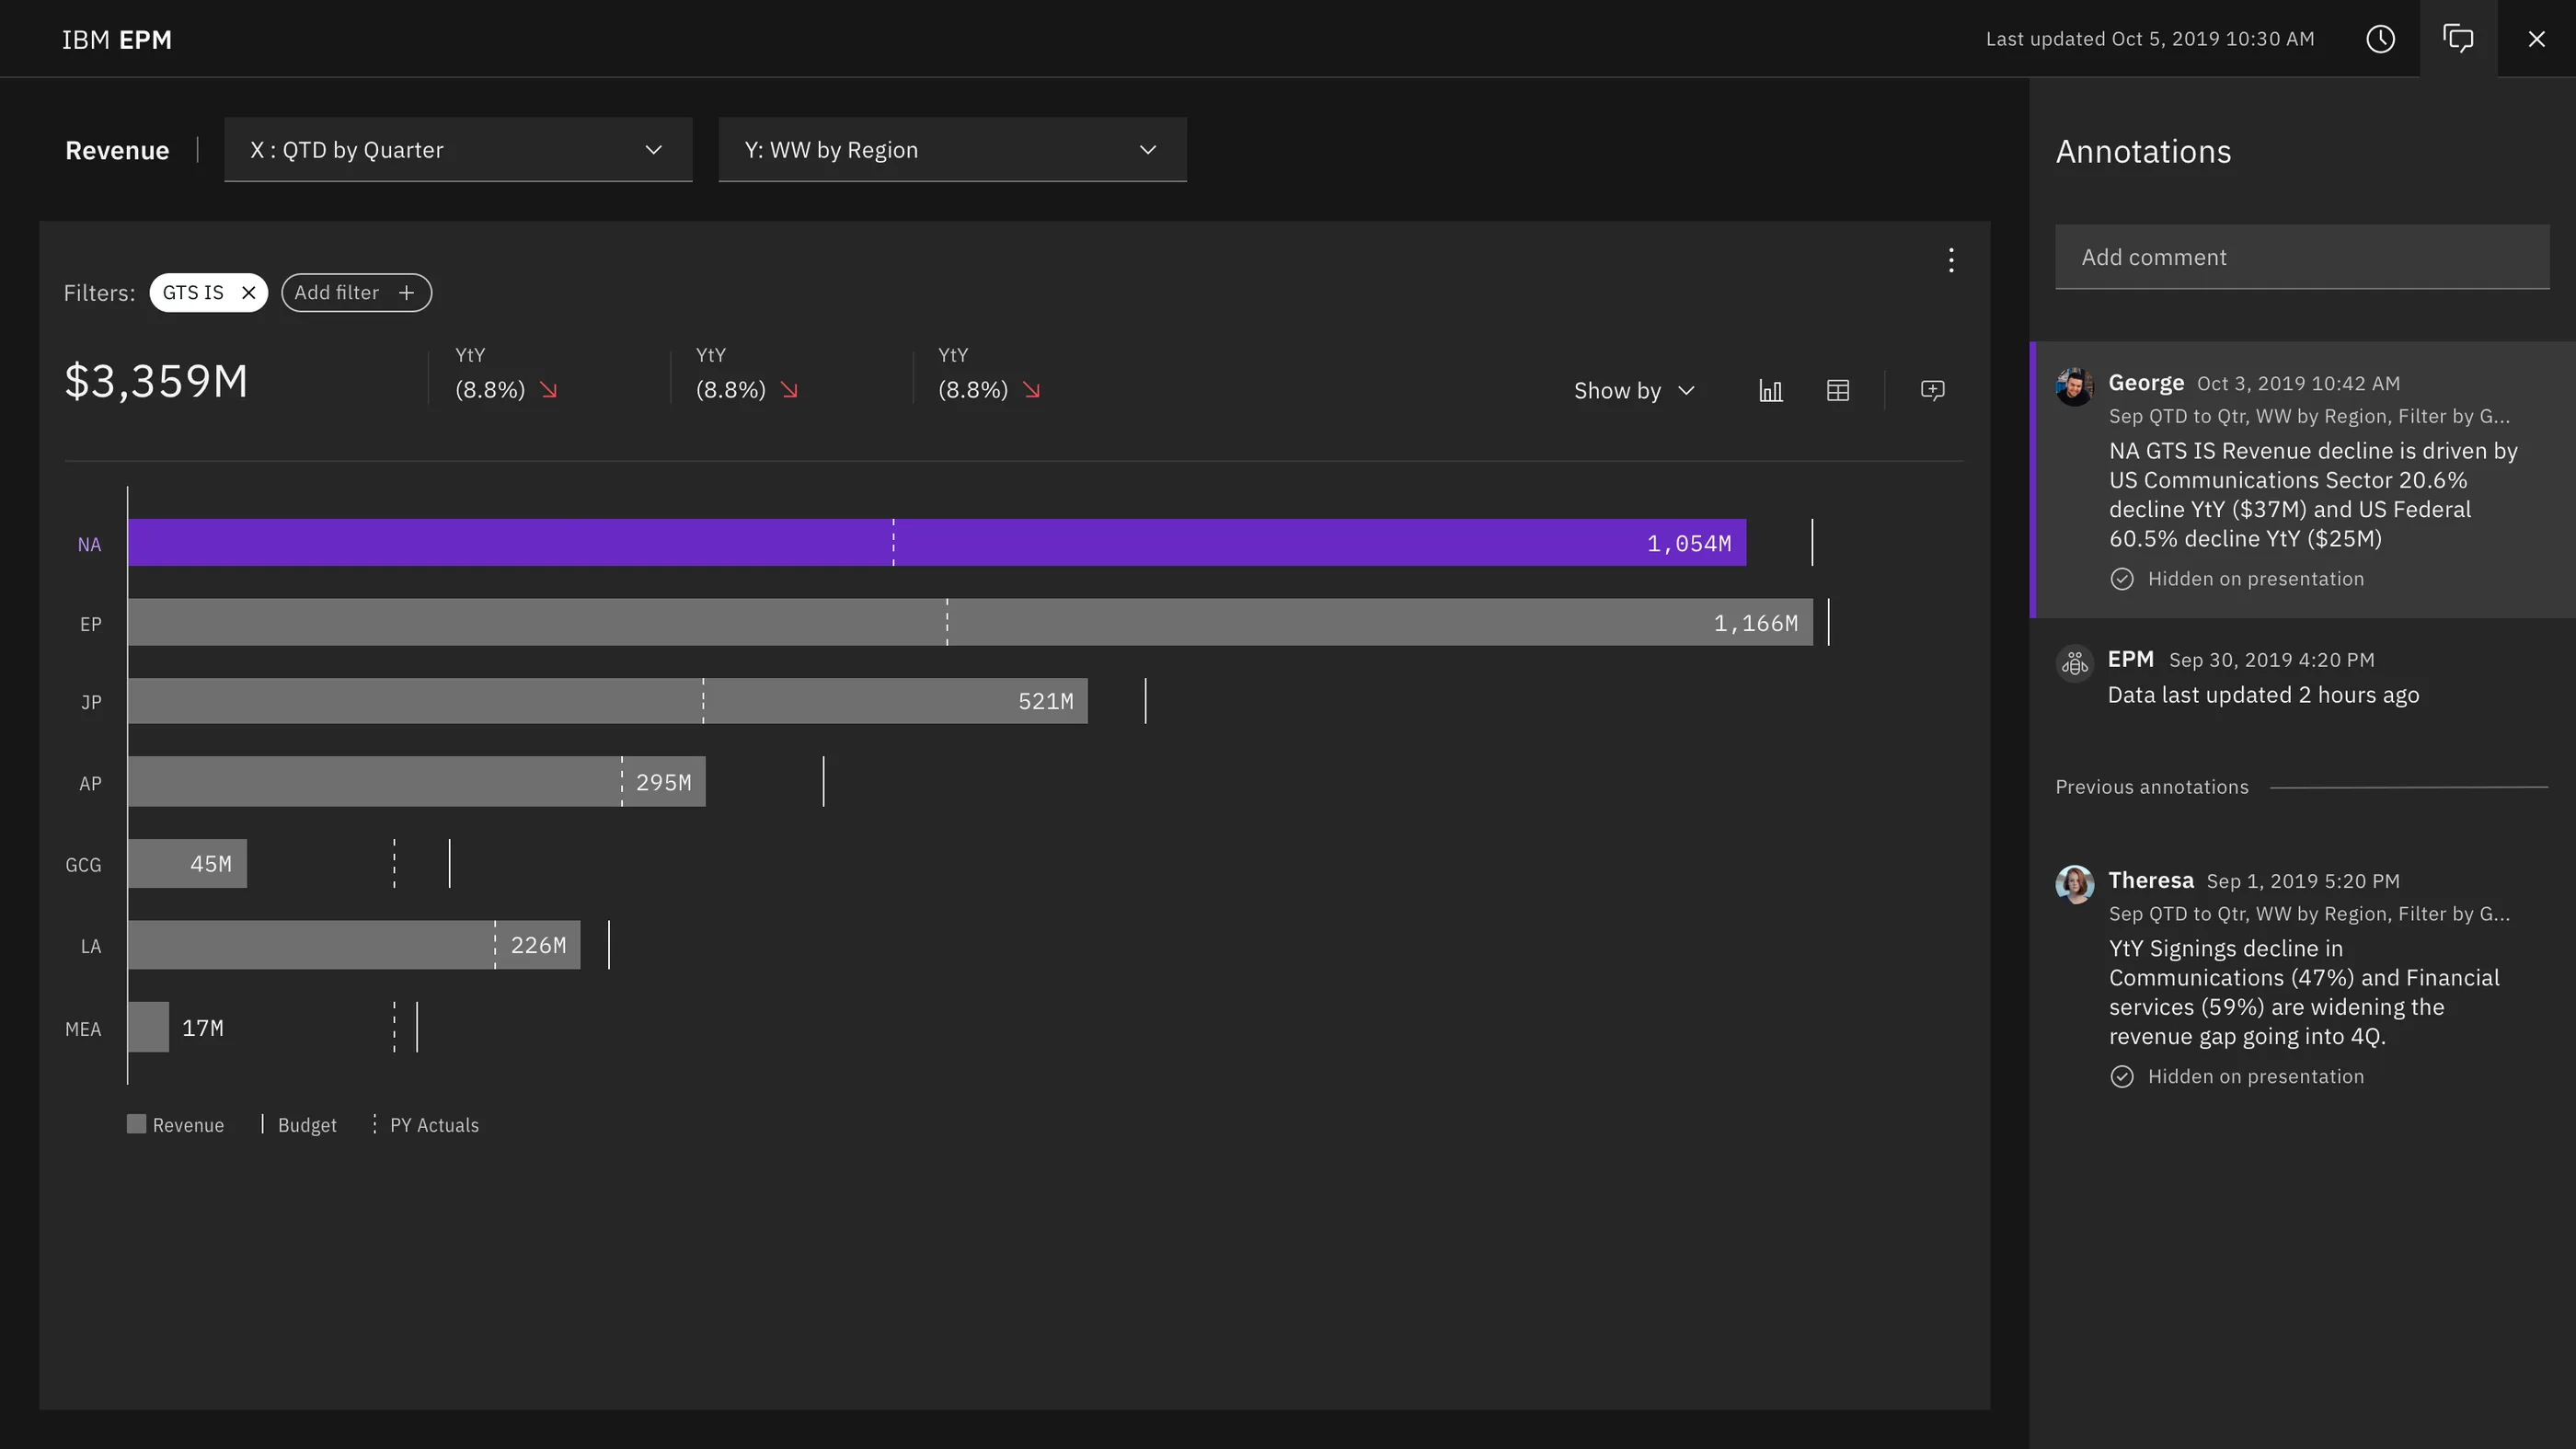
    Article + annotations

    Article + annotations EPM Next prototype screen

    Discuss the evidence

    Keep explanations, feedback, and source data together around the same observation.

  6. 06

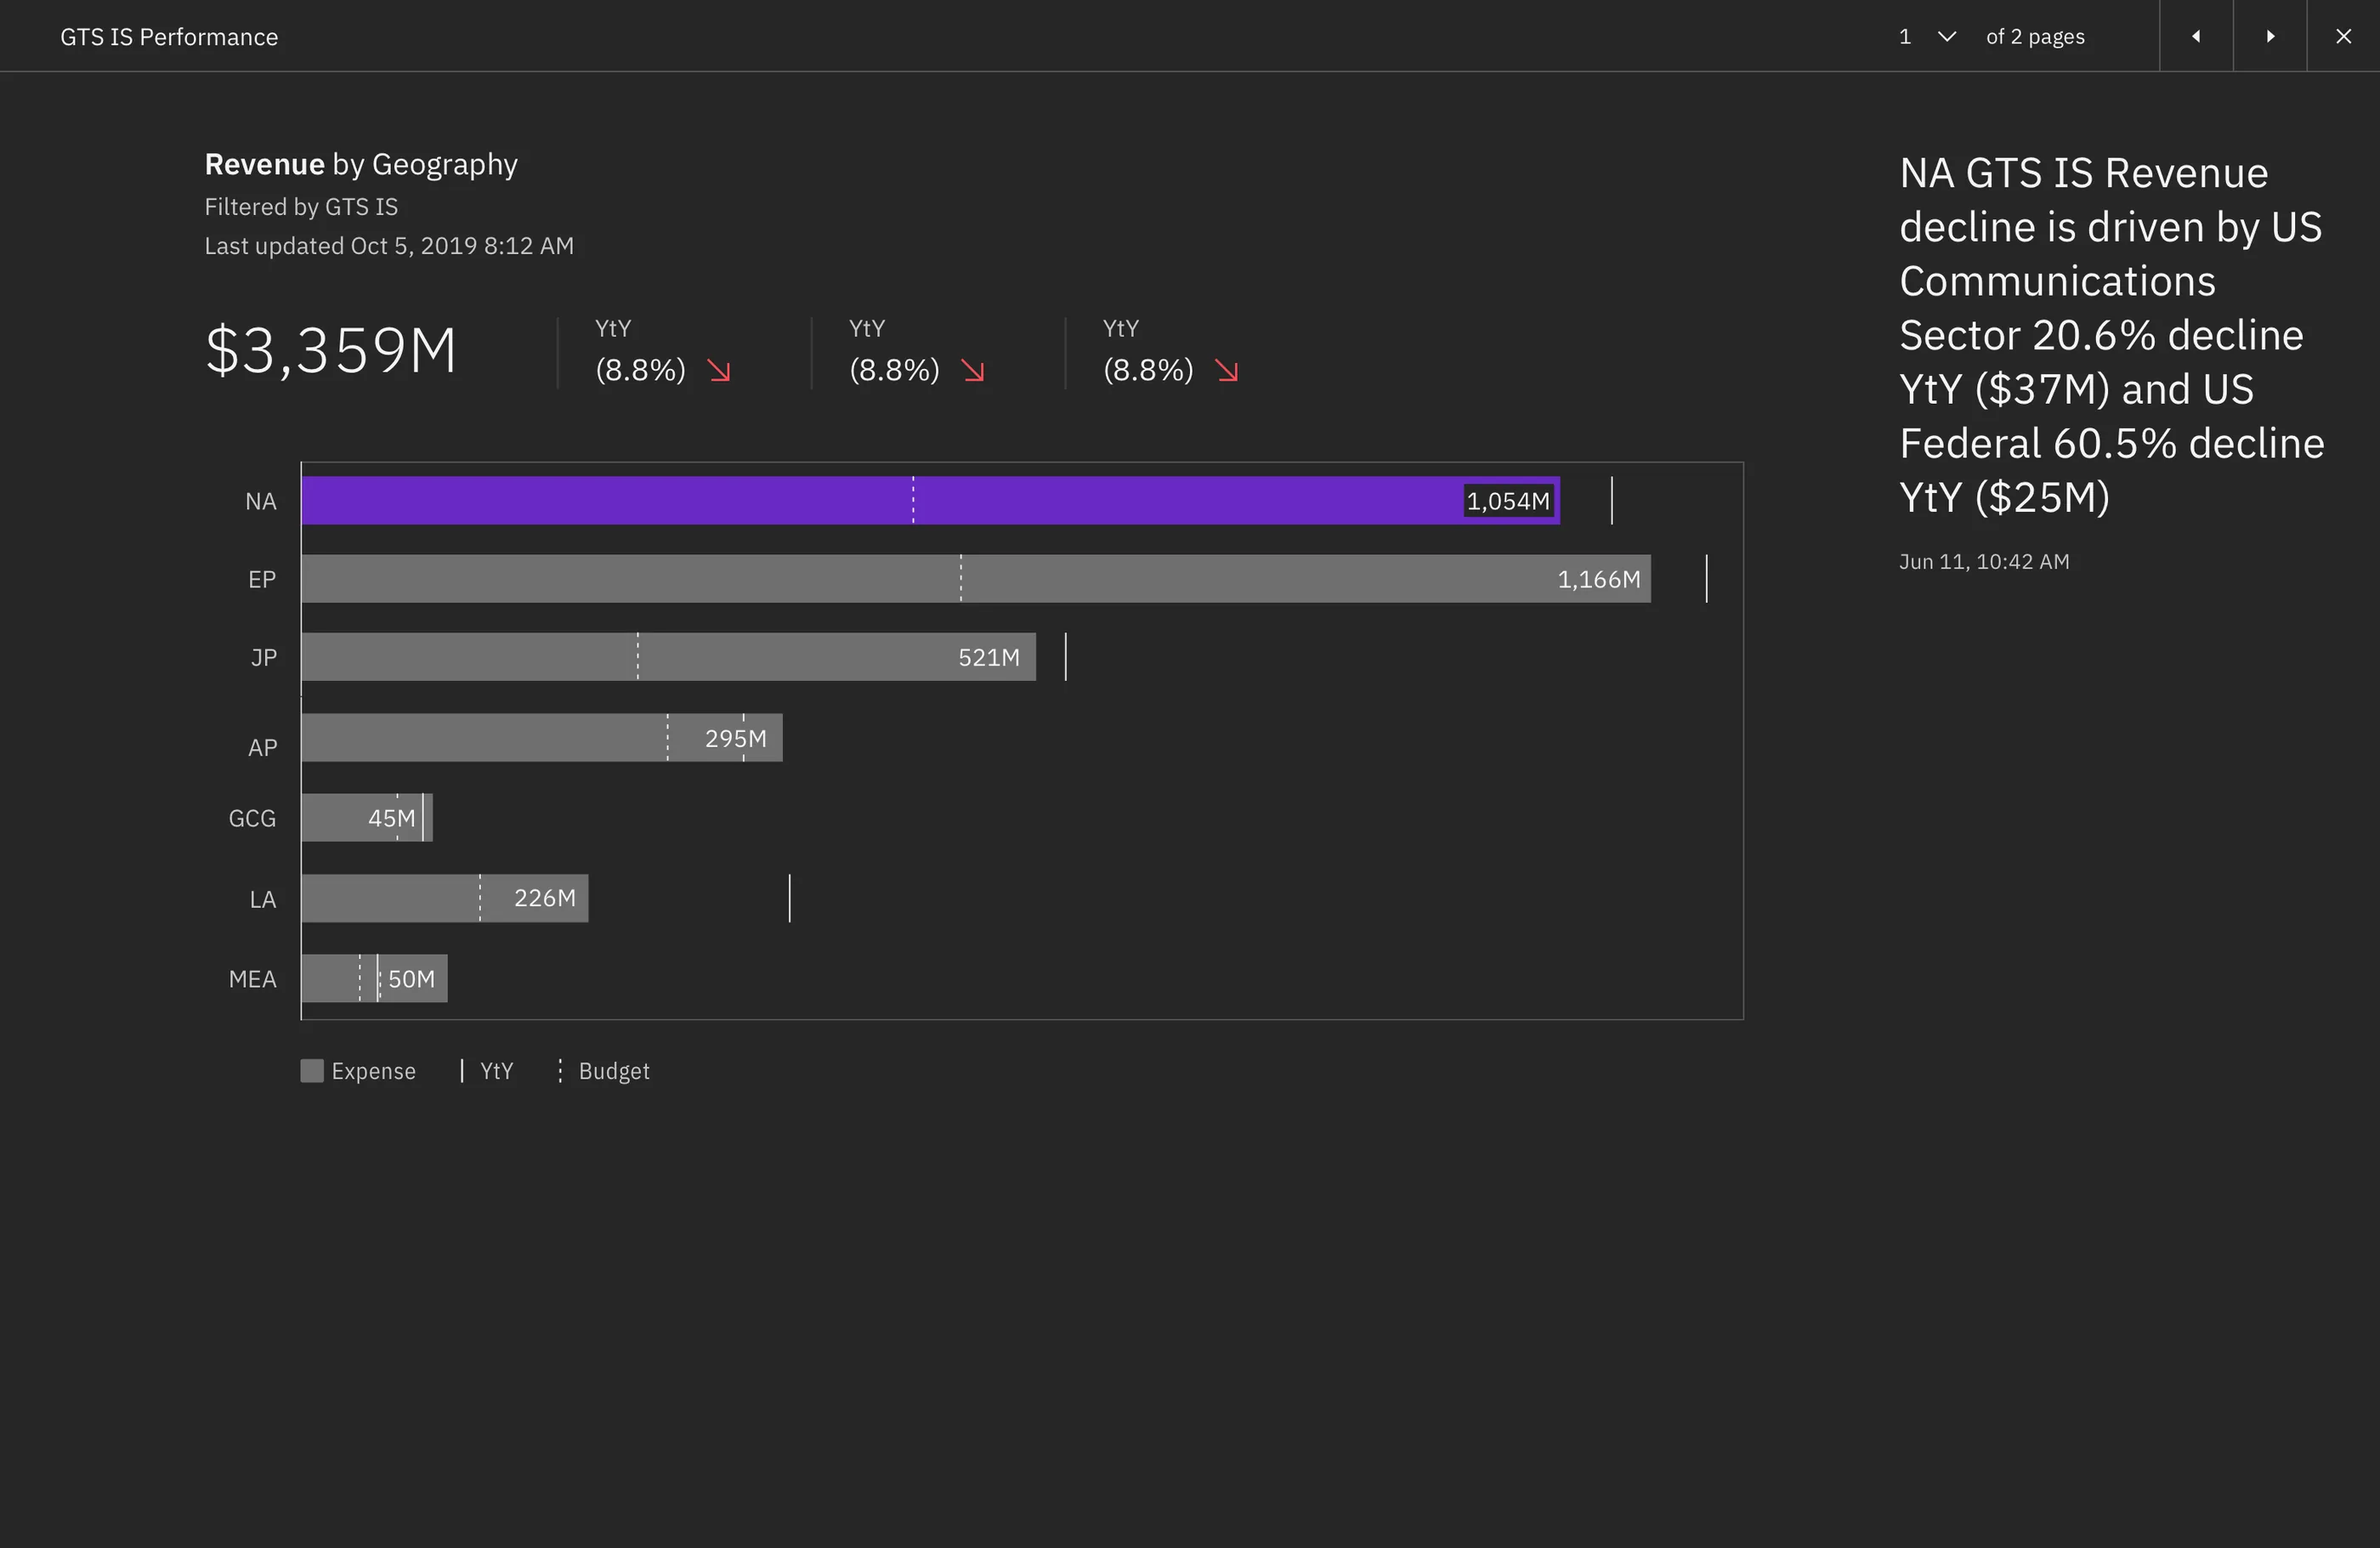
    Presentation

    Presentation EPM Next prototype screen

    Bring the point of view to review

    Carry the evidence and narrative into the meeting where a decision is made.

What testing changed

Evidence from beta research guided the next interaction decisions.

  1. 17 / 20

    Observed

    People missed “Add new” without a cue.

    Response: make creation actions explicit, contextual, and easy to find.
  2. 8 / 8

    Validated

    People understood a concise case invitation and acted on it quickly.

    Response: keep collaboration messages direct, with one clear action.
  3. 10 / 11

    Observed

    People could not define an Article as a business fact.

    Response: use clearer language and explain the Article, Story, and Case hierarchy in context.

Interaction deep dive

Article creation turned a hidden action into an explicit way to add evidence.

The final modal brings data selection, dimensions, filters, and calculations into the Story—without breaking the reporting flow.

Add new article modal in the final EPM Next interface
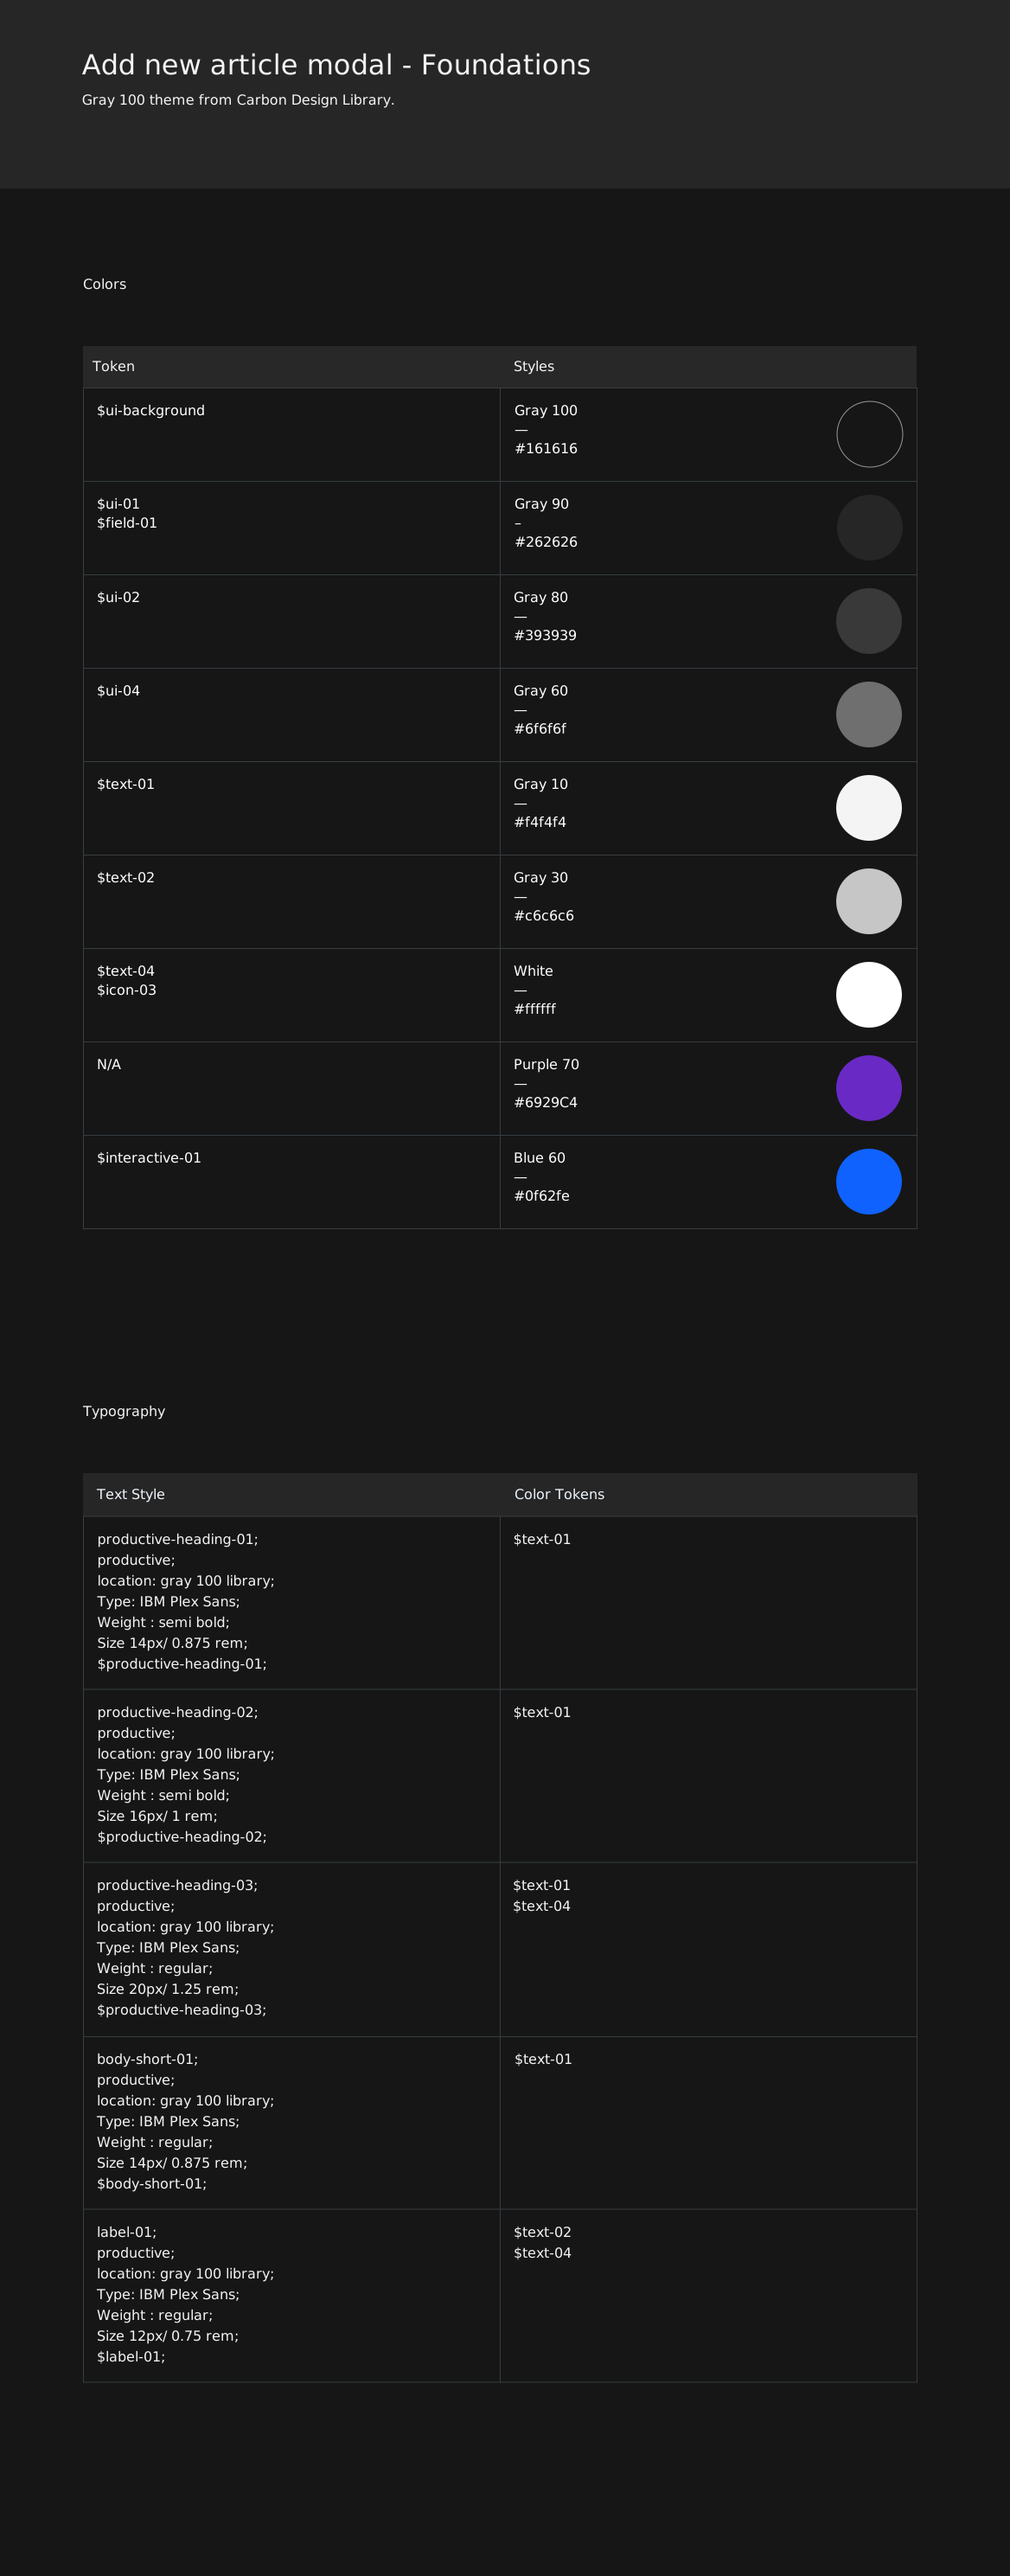
Foundations specification for the add new article modal

Foundations

Carbon tokens and contrast decisions established a consistent dark-modal baseline.

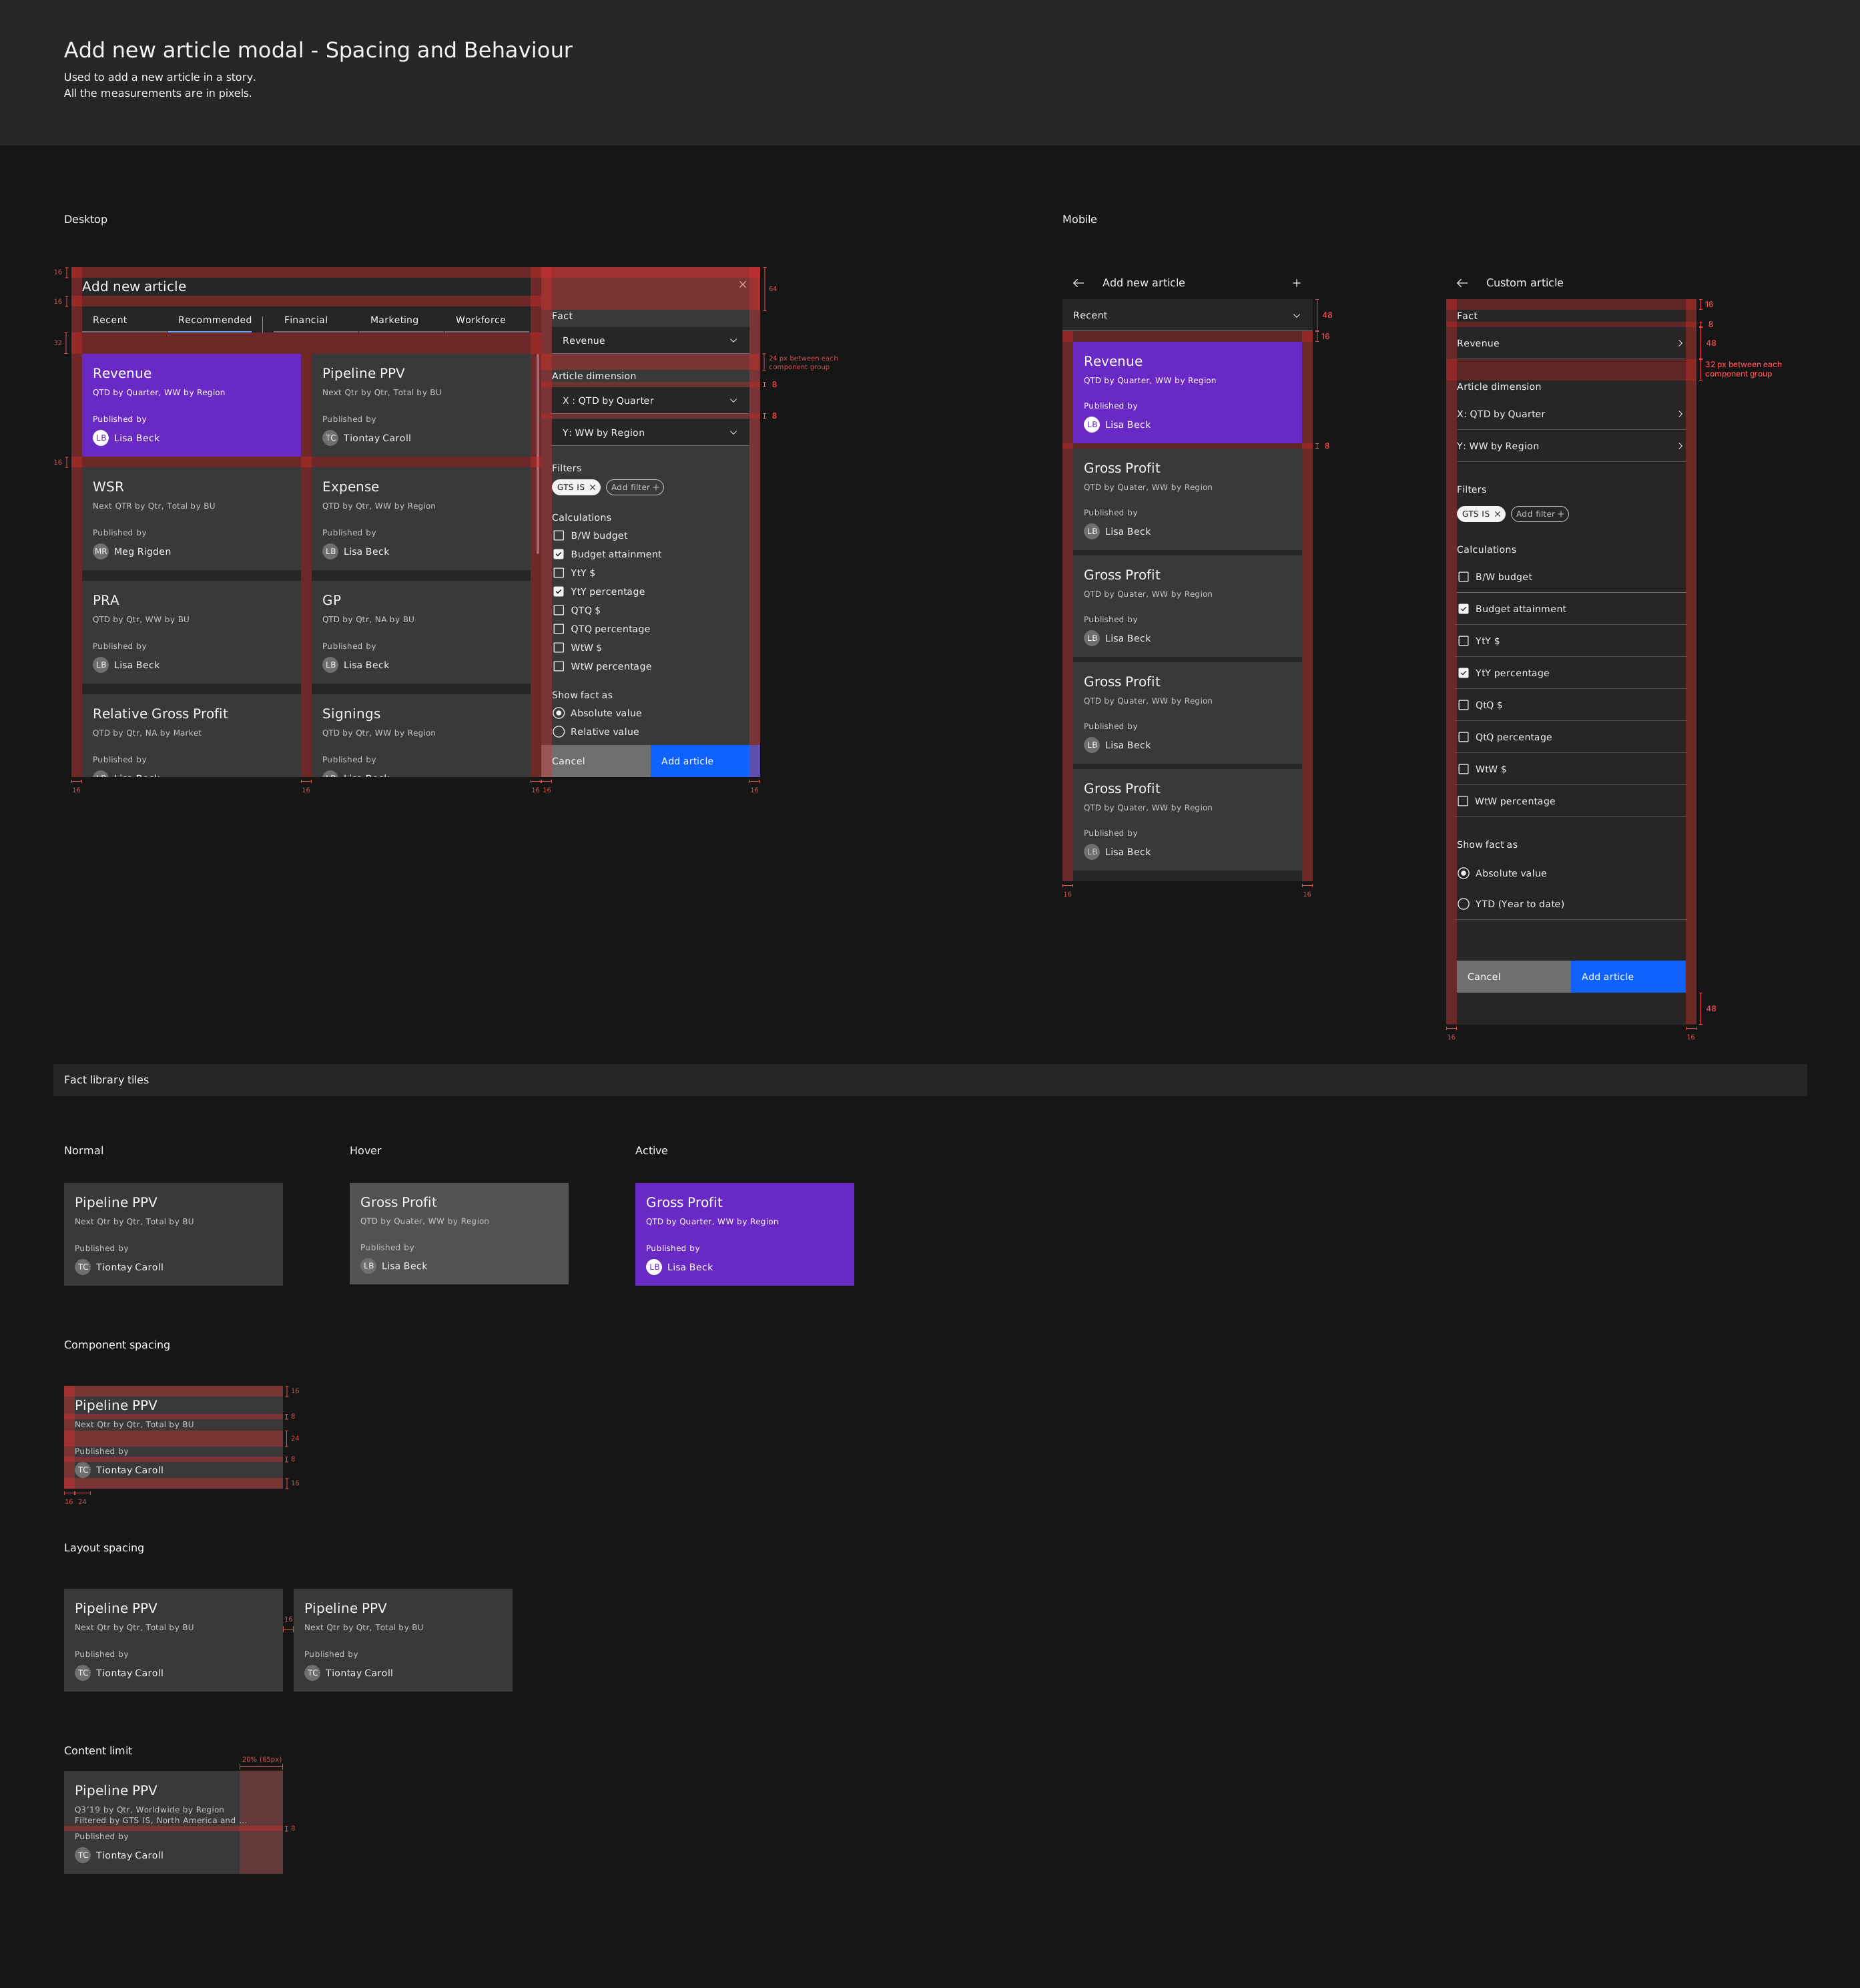
Spacing & behaviour specification for the add new article modal

Spacing & behaviour

Layout, selection, and error states were specified before moving into detailed build work.

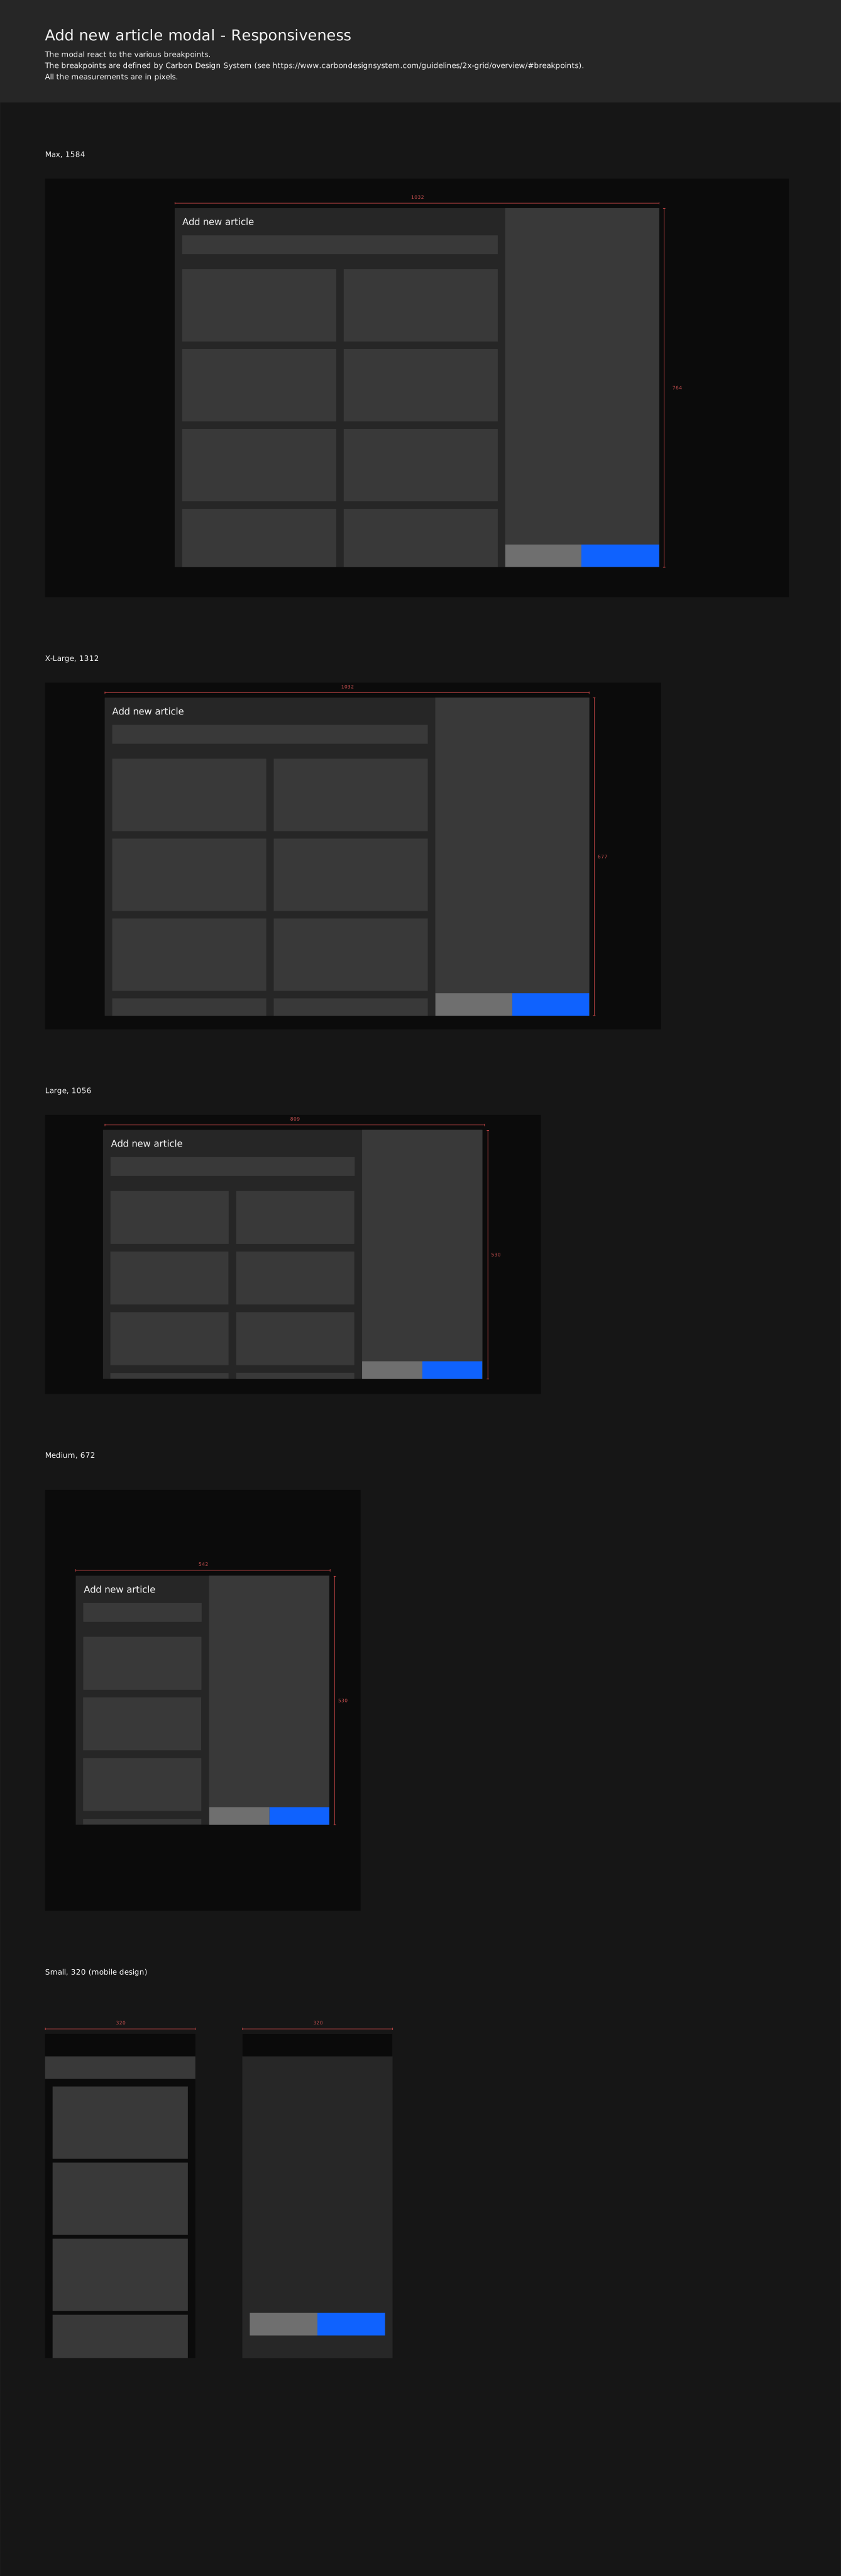
Responsive states specification for the add new article modal

Responsive states

The article-creation flow was checked across constrained widths, not treated as a desktop-only interaction.

The direction

Clarity is not less complexity. It is giving complexity a place to make sense.

By connecting performance data, narrative, and collaboration in one system, EPM Next gives enterprise teams a calmer, more coherent way to move from insight to action.